Full Report
The numbers behind FactSet Research Systems Inc.: as-reported financial statements and company metrics for FY2021–FY2025, traced to the source filings, opened with the share-price history those statements have to justify. Every linked figure opens the exact page of the filing it was printed on, with the statement row highlighted. Amounts in US$ thousands unless noted.
Reading notes: Display unit is thousands of US dollars (US$ thousands), exactly as FactSet's consolidated statements are printed ('in thousands, except per share data'). Per-share and KPI-count rows are exempt from that scale. FactSet's fiscal year ends August 31. Each fiscal year is cited to its own Form 10-K (FY2021–FY2025); every value in the five annual statement columns is verified against the cited filing page. Income statement presentation drift: the FY2022, FY2023 and FY2024 10-Ks break out an 'Asset impairments' line below SG A; the FY2021 and FY2025 10-Ks (and the standardized data feed) fold it into SG A. This tab shows each year's own-10-K presentation, so 'Asset impairments' is $0 in FY2021/FY2025 and SG A for FY2023/FY2024 differs from the data feed (see discrepancies). In FY2021 and FY2022 the income statement reported interest on a net basis ('Interest expense, net'); FY2023 onward splits Interest income and Interest expense. The Interest income/Interest expense rows are therefore blank for FY2021–FY2022, while 'Total other income (expense), net' is populated for every year.
Share Price — Full Available History — 30 Years
The stock closed at $262.46 on Jul 16, 2026 — up 26,501% over the window shown (+20.4% a year), trading between $0.78 and $495.72. At that close the stock trades at 17× FY2025 diluted EPS as reported below.
Source: market price feed, monthly closes, sampled from 7,559 source observations, Jun 1996–Jul 2026. Price return only, excludes dividends. Prices are split-adjusted (×1.5 on Feb 08, 1999; 1:2 on Feb 07, 2000; ×1.5 on Feb 07, 2005).
FY2025 at a Glance
Revenue (US$ thousands)
Operating income (US$ thousands)
Net income (US$ thousands)
Diluted EPS
Source: FY2025 consolidated statements [1] [2] [3] [4]. Click any linked figure to open the filing page with the row highlighted.
Revenue by Geographic Segment
| Revenue by Geographic Segment | FY2021 | FY2022 | FY2023 | FY2024 | FY2025 |
|---|---|---|---|---|---|
| Americas | 1,008,046 | 1,173,946 | 1,335,484 | 1,419,901 | 1,506,108 |
| EMEA | 427,700 | 484,279 | 539,843 | 563,128 | 580,284 |
| Asia Pacific | 155,699 | 185,667 | 210,181 | 220,027 | 235,356 |
| Consolidated | 1,591,445 | 1,843,892 | 2,085,508 | 2,203,056 | 2,321,748 |
Source: Note 15, Segment Information — reportable geographic segments (Americas, EMEA, Asia Pacific) [5] [6] [7] [8]. Click any linked figure to open the filing page with the row highlighted.
Operating Income by Geographic Segment
| Operating Income by Geographic Segment | FY2021 | FY2022 | FY2023 | FY2024 | FY2025 |
|---|---|---|---|---|---|
| Americas | 218,180 | 159,140 | 239,438 | 261,790 | 305,963 |
| EMEA | 159,704 | 196,231 | 243,028 | 282,963 | 274,002 |
| Asia Pacific | 96,157 | 120,111 | 146,741 | 156,546 | 168,338 |
| Consolidated | 474,041 | 475,482 | 629,207 | 701,299 | 748,303 |
Source: Note 15, Segment Information — results of operations of our segments [5] [6] [7] [8]. Click any linked figure to open the filing page with the row highlighted.
Income Statement
Source: Consolidated Statements of Income [1] [2] [3] [4]. Click any linked figure to open the filing page with the row highlighted.
Columns marked E are consensus analyst estimates shown alongside reported results for direct comparison; they are not company guidance.
Estimate source: Yahoo Finance analyst consensus, as of 2026-07-17. Estimate figures link to the consensus source, not to filing pages.
Balance Sheet
Source: Consolidated Balance Sheets [9] [10] [11] [12]. Click any linked figure to open the filing page with the row highlighted.
Cash Flow
Source: Consolidated Statements of Cash Flows [13] [14] [15] [16]. Click any linked figure to open the filing page with the row highlighted.
Annual Subscription Value (ASV) Growth
| Annual Subscription Value (ASV) Growth | FY2021 | FY2022 | FY2023 | FY2024 | FY2025 |
|---|---|---|---|---|---|
| ASV plus Professional Services (as reported) | 1,688,300 | 2,002,100 | 2,174,600 | 2,276,000 | — |
| Organic ASV plus Professional Services | 1,678,500 | 1,837,000 | 2,175,100 | 2,272,800 | — |
| ASV (as reported, ex-professional services) | — | — | — | — | 2,405,600 |
| Organic ASV (ex-professional services) | — | — | — | — | 2,370,900 |
| Organic ASV growth rate | 7.2% | 9.3% | 7.1% | 4.8% | 5.7% |
Source: company filings [17] [18] [19] [20]. Click any linked figure to open the filing page with the row highlighted.
Clients, Users Retention
| Clients, Users Retention | FY2021 | FY2022 | FY2023 | FY2024 | FY2025 |
|---|---|---|---|---|---|
| Total clients (ASV ≥ $10,000) | — | — | — | 8,217 | 8,996 |
| Users (professionals on the platform) | — | — | — | 216,381 | 237,324 |
| Client retention (% of clients) | 91.0% | 92.0% | 91.0% | 90.0% | 91.0% |
| Buy-side share of ASV | 83.2% | 83.0% | 82.0% | 82.0% | 82.0% |
| Sell-side share of ASV | — | 17.0% | 18.0% | 18.0% | 18.0% |
| Employee headcount | 10,892 | 11,203 | 12,237 | 12,398 | 12,800 |
Source: company filings [21] [22] [23] [24]. Click any linked figure to open the filing page with the row highlighted.
Annual Subscription Value by Region
| Annual Subscription Value by Region | FY2021 | FY2022 | FY2023 | FY2024 | FY2025 |
|---|---|---|---|---|---|
| Americas ASV | 1,039,400 | 1,262,400 | 1,376,900 | 1,456,800 | 1,570,100 |
| EMEA ASV | 450,000 | 515,300 | 559,600 | 570,300 | 591,600 |
| Asia Pacific ASV | — | 200,400 | 215,400 | 230,600 | 243,900 |
Source: company filings [17] [18] [19] [25]. Click any linked figure to open the filing page with the row highlighted.
Profitability Cash Flow (as adjusted / non-GAAP)
| Profitability Cash Flow (as adjusted / non-GAAP) | FY2021 | FY2022 | FY2023 | FY2024 | FY2025 |
|---|---|---|---|---|---|
| Adjusted operating income | 517,694 | 624,395 | 754,188 | 832,653 | 843,432 |
| Adjusted operating margin | 32.5% | 33.9% | 36.2% | 37.8% | 36.3% |
| Adjusted EBITDA | 540,293 | 628,179 | 776,620 | 847,538 | 934,973 |
| Adjusted diluted EPS | 11.20 | 13.43 | 14.65 | 16.45 | 16.98 |
| Free cash flow | 493,901 | 487,121 | 584,787 | 614,657 | 617,454 |
Source: company filings [26] [27] [28] [29]. Click any linked figure to open the filing page with the row highlighted.
Long-Term Record
| Fiscal year | Total revenue | Operating income | Net income | Diluted earnings per common share | Net cash provided by operating activities |
|---|---|---|---|---|---|
| FY2016 | — | 349,676 | 338,815 | 8.19 | 331,140 |
| FY2017 | — | 352,135 | 258,259 | 6.51 | 320,527 |
| FY2018 | 1,350,145 | 366,204 | 267,085 | 6.78 | 385,668 |
| FY2019 | 1,435,351 | 438,035 | 352,790 | 9.08 | 427,136 |
| FY2020 | 1,494,111 | 439,660 | 372,938 | 9.65 | 505,840 |
| FY2021 | 1,591,445 | 474,041 | 399,590 | 10.36 | 555,226 |
| FY2022 | 1,843,892 | 475,482 | 396,917 | 10.25 | 538,277 |
| FY2023 | 2,085,508 | 629,207 | 468,173 | 12.04 | 645,573 |
| FY2024 | 2,203,056 | 701,299 | 537,126 | 13.91 | 700,338 |
| FY2025 | 2,321,748 | 748,303 | 597,040 | 15.55 | 726,260 |
Source: consolidated statements across filings; older years from the standardized feed [13] [1] [14] [2]. Click any linked figure to open the filing page with the row highlighted.
Operating KPIs
| KPI | FY2021 | FY2022 | FY2023 | FY2024 | FY2025 |
|---|---|---|---|---|---|
| Annual Subscription Value (ASV), as reported | — | — | — | 2,255,400 | 2,405,600 |
| Organic ASV | — | — | — | — | 2,370,900 |
| ASV plus Professional Services, as reported | 1,688,300 | 2,027,400 | 2,174,600 | 2,276,000 | — |
| Total Clients with ASV over $10,000 | 6,453 | 7,538 | 7,921 | 8,217 | 8,996 |
| Total Users | — | — | — | 216,381 | 237,324 |
Source: company-reported operating metrics [17]. Click any linked figure to open the filing page with the row highlighted.
Analyst Consensus
Current price
Mean target
Median target
High target
Low target
Estimate source: Yahoo Finance analyst consensus, as of 2026-07-17. Estimate figures link to the consensus source, not to filing pages.
Traceability
489 of 526 figures on this page (93%) link to the filing page where they are printed — click a linked figure to open the source PDF at that page with the row highlighted. Unlinked figures come from standardized data feeds or pre-filing years.
Display unit is thousands of US dollars (US$ thousands), exactly as FactSet's consolidated statements are printed ('in thousands, except per share data'). Per-share and KPI-count rows are exempt from that scale.
FactSet's fiscal year ends August 31. Each fiscal year is cited to its own Form 10-K (FY2021–FY2025); every value in the five annual statement columns is verified against the cited filing page.
Income statement presentation drift: the FY2022, FY2023 and FY2024 10-Ks break out an 'Asset impairments' line below SG A; the FY2021 and FY2025 10-Ks (and the standardized data feed) fold it into SG A. This tab shows each year's own-10-K presentation, so 'Asset impairments' is $0 in FY2021/FY2025 and SG A for FY2023/FY2024 differs from the data feed (see discrepancies).
In FY2021 and FY2022 the income statement reported interest on a net basis ('Interest expense, net'); FY2023 onward splits Interest income and Interest expense. The Interest income/Interest expense rows are therefore blank for FY2021–FY2022, while 'Total other income (expense), net' is populated for every year.
Revenue and operating income by geographic segment are taken from the Segment Information note (Note 15) of each year's 10-K, which reports Americas, EMEA and Asia Pacific as the reportable segments; the FY2021–FY2022 10-Ks label the row 'Revenue' (singular) and FY2023 onward 'Revenues'.
FY2016–FY2020 figures in the Long-Term Record are from the standardized data feed (SEC XBRL) and are shown without page links (those filings are not in the corpus); FY2016–FY2017 total revenue is not carried by the feed. FY2021–FY2025 long-term figures are verified to the filings.
Quarterly cash-flow single quarters are derived from the printed year-to-date statements in each Form 10-Q (Q1 as printed; Q2 = 6-month YTD minus Q1 3-month YTD; Q3 = 9-month YTD minus 6-month YTD). Every derived value reconciles exactly to the two printed YTD figures and was cross-checked against the quarterly data feed.
KPIs: FY2025 ASV and Organic ASV are cited to the FY2025 10-K (MD A, in $ millions; shown here rescaled to thousands). Other ASV, client-count (clients with ASV $10,000) and user-count figures are from the fiscal.ai data feed and are shown without page links — the 10-Ks disclose these only in rounded prose (e.g. '~9,000 clients', 'over 237,000 investment professionals'). The subscription metric's definition changed across years (ASV plus Professional Services through FY2024; ASV headline from FY2025).
2 figure(s) differed between the data feed and the filing; the filing value is shown (see the run's metrics/metrics_tab.json for the audit trail).
FactSet Research Systems Inc.'s management explains the business in its own materials. The slides below do the most of that work, pulled from the documents preserved in Sources. Each source link opens the complete presentation at that slide in a new tab.
Q3 FY2026 Earnings Presentation — Q3 FY2026
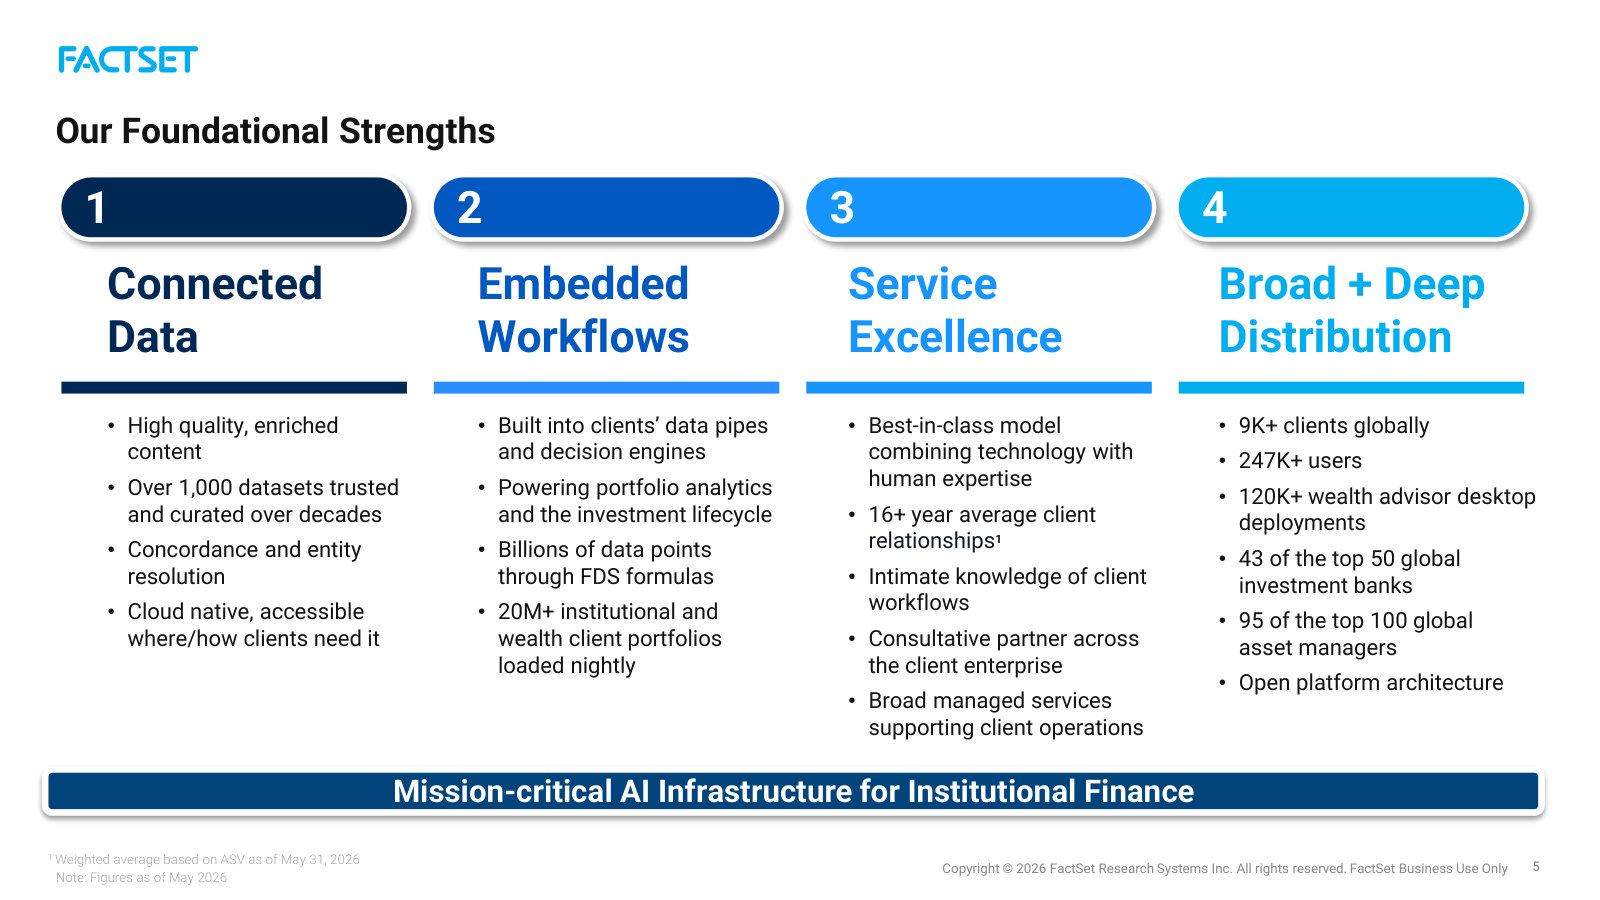
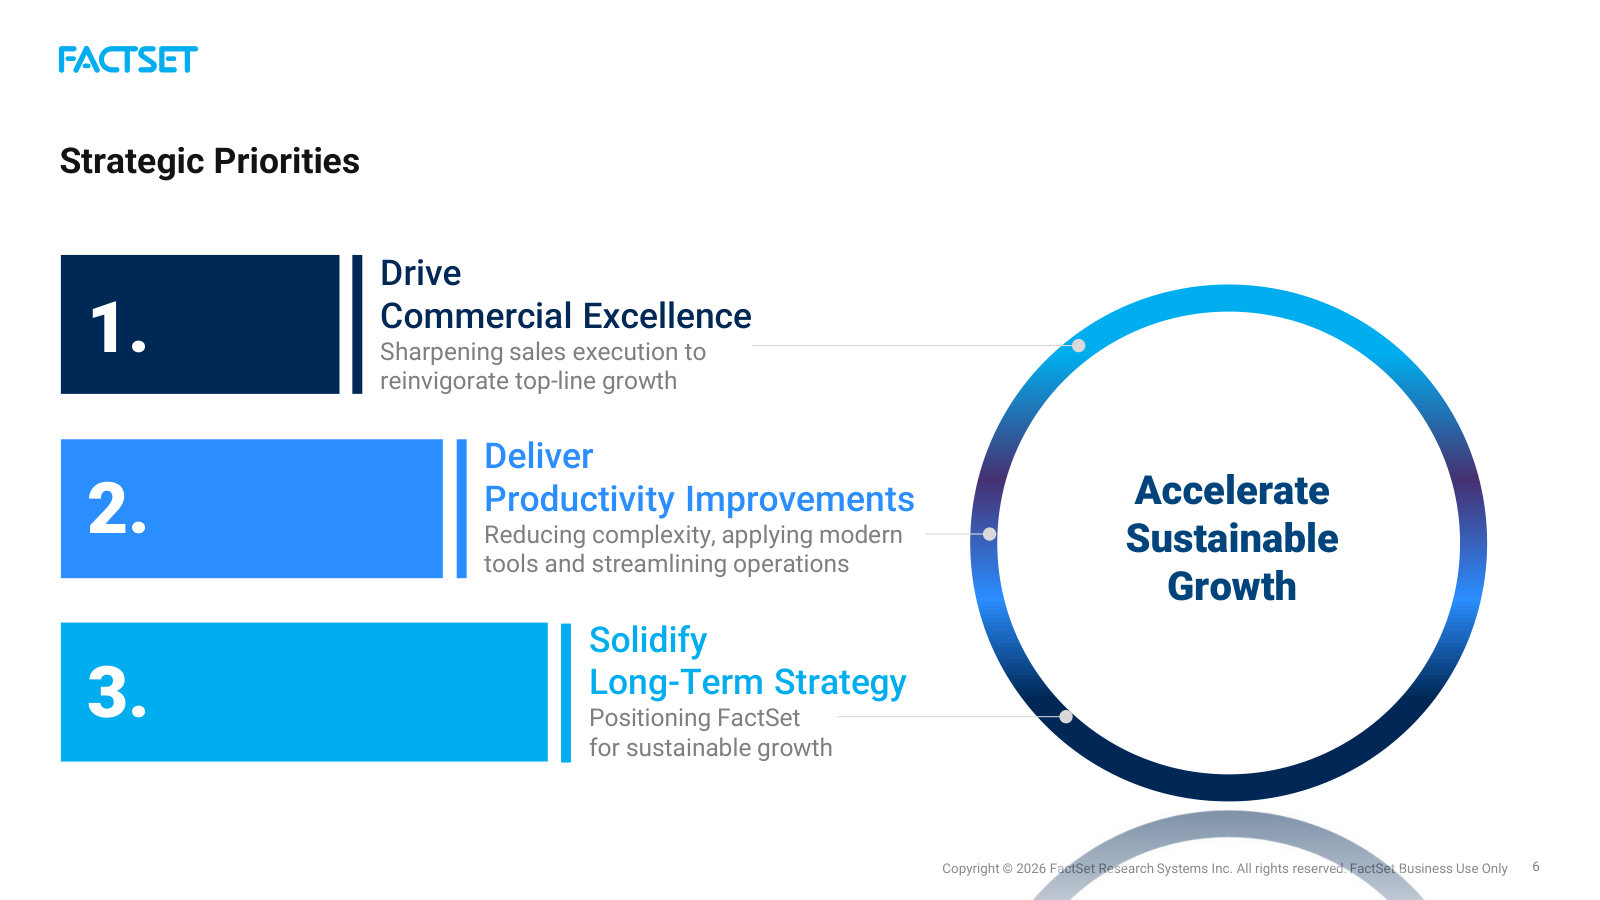
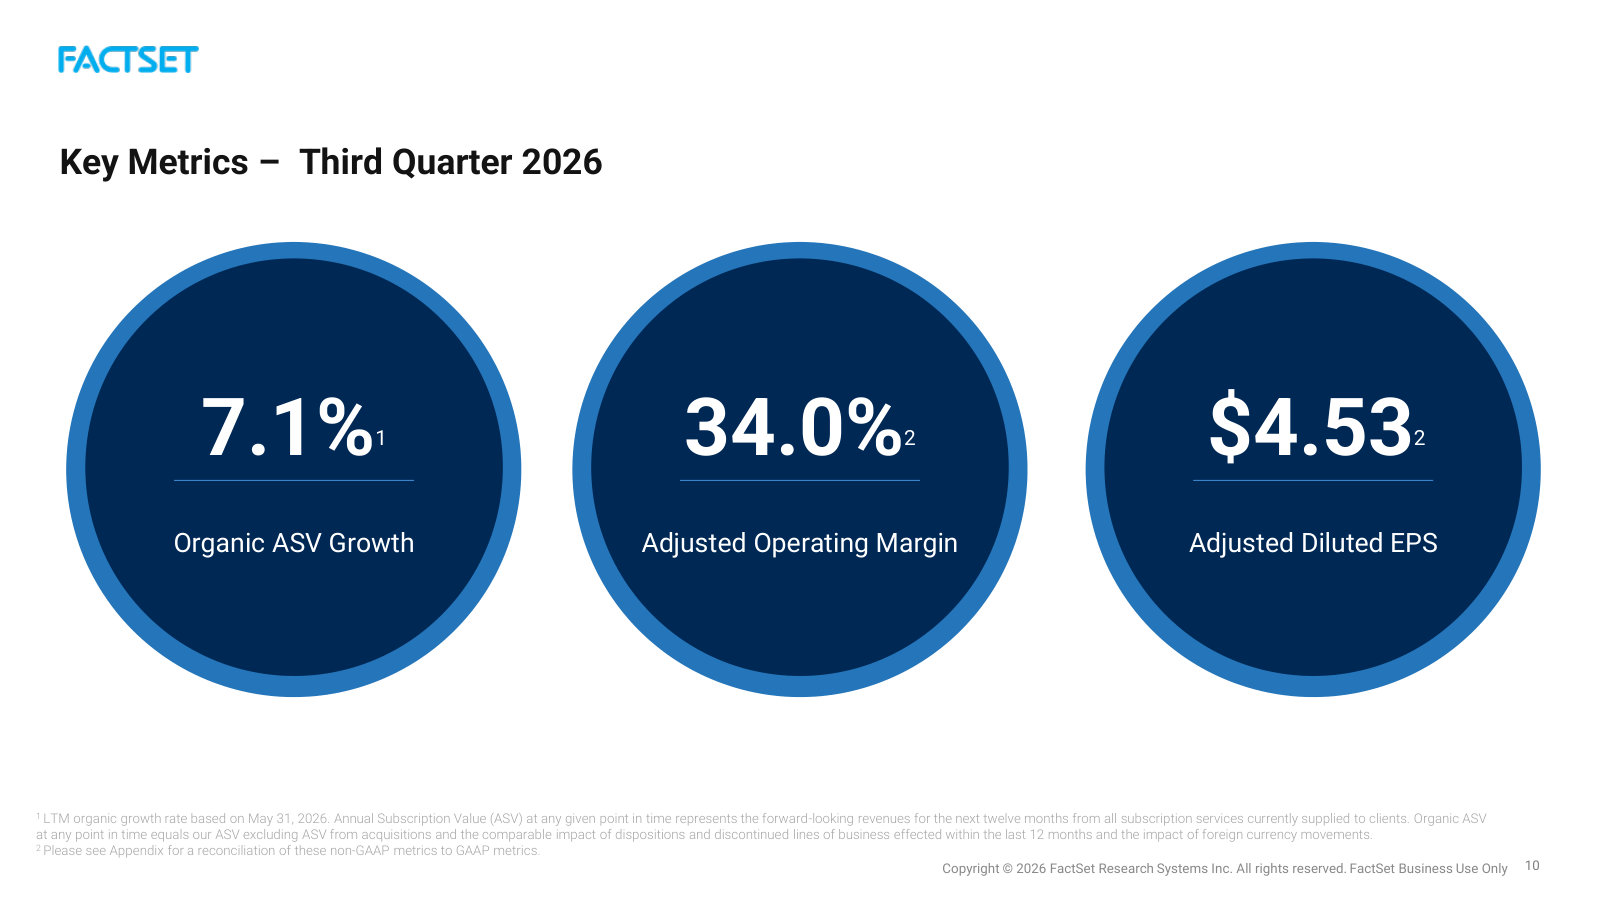
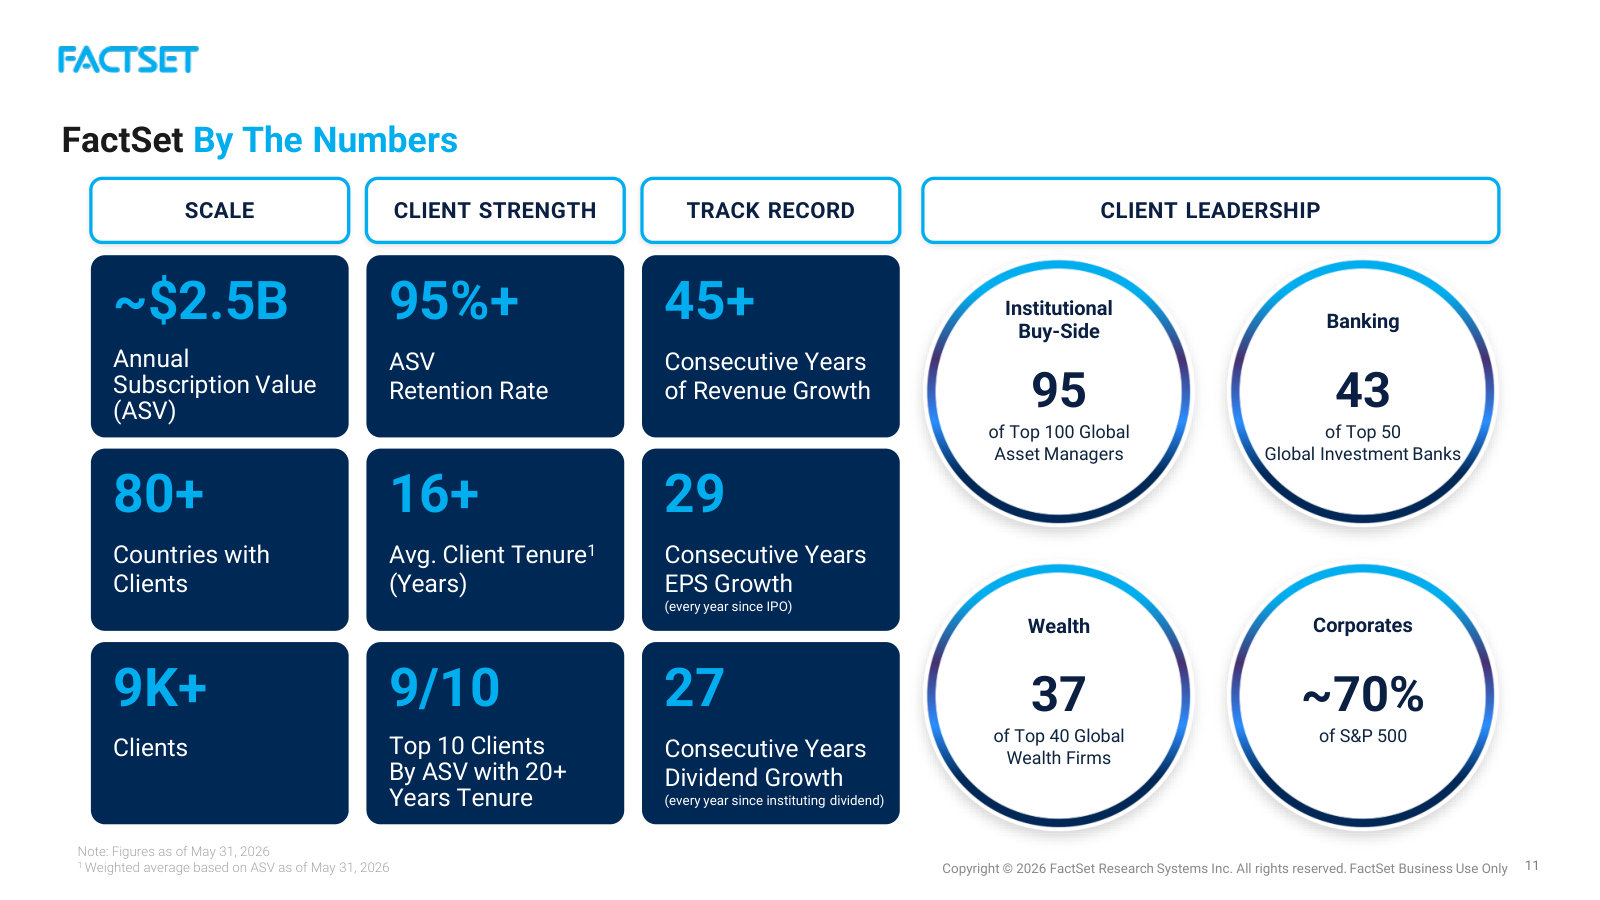
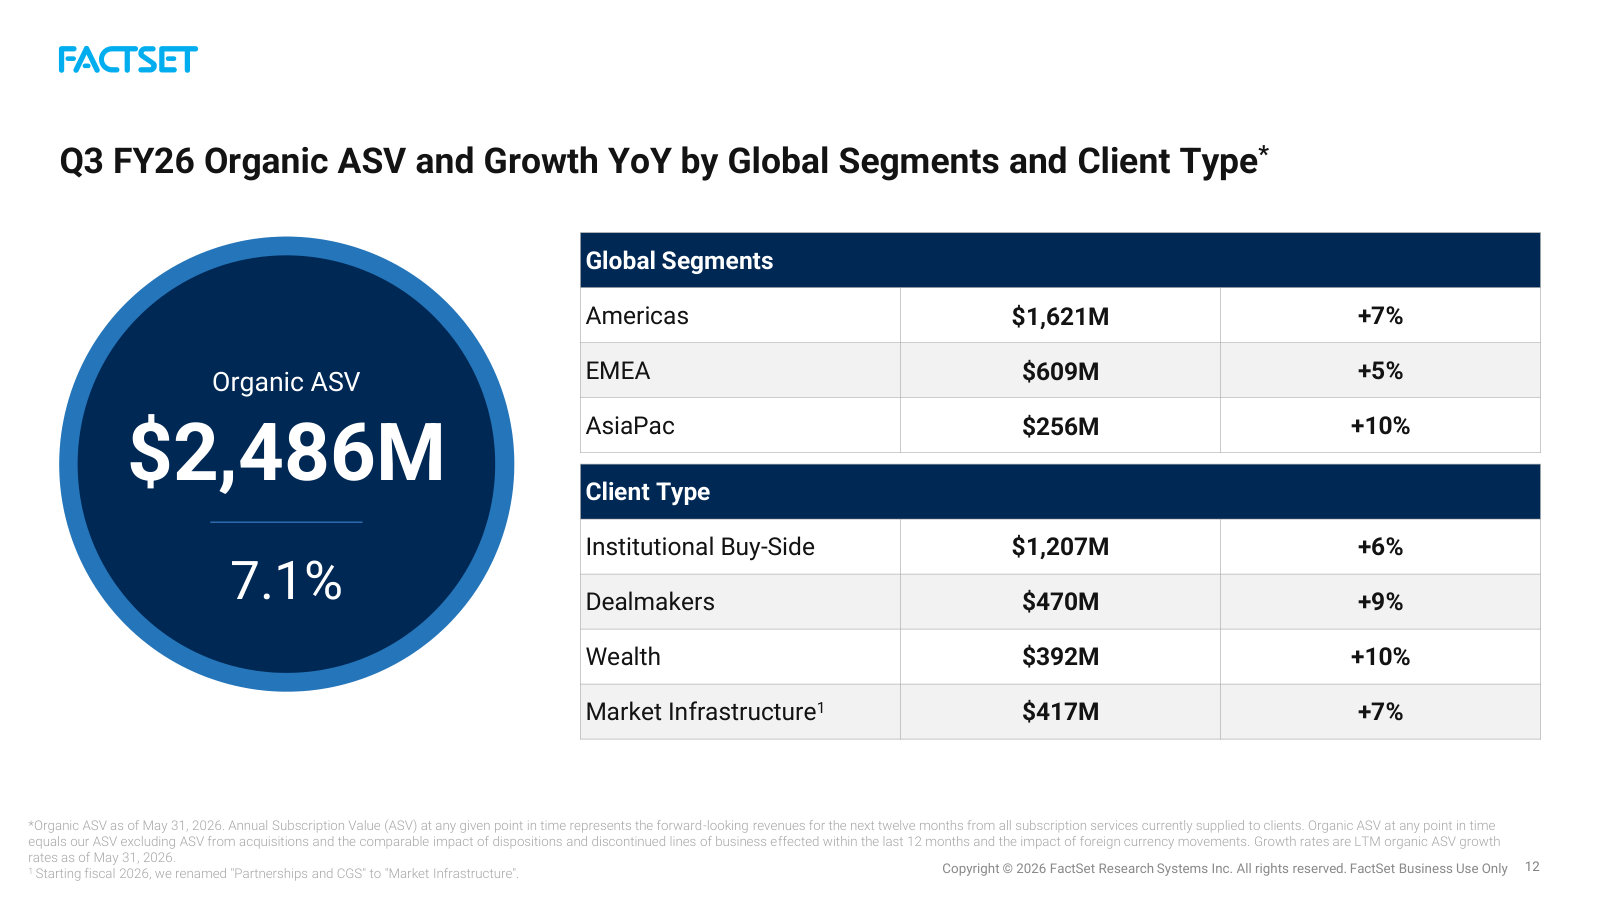
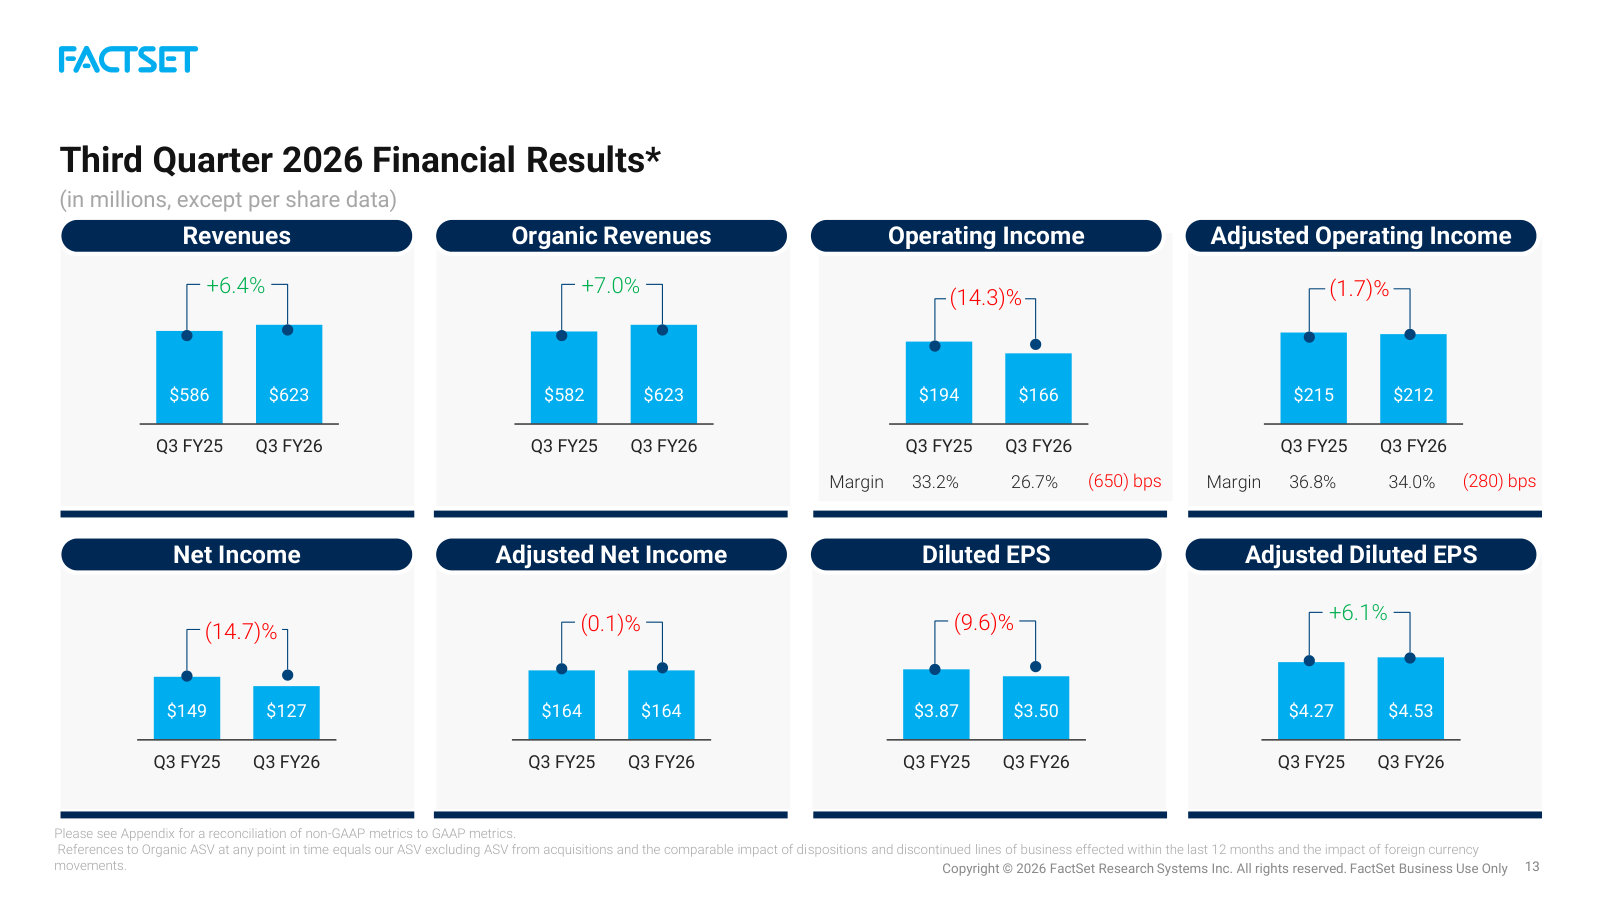
FactSet's fullest current self-portrait: what the platform is, how it grows, its scale and segment mix, and the FY26 margin picture. · Open the full document →
Q2 FY2026 Earnings Presentation — Q2 FY2026
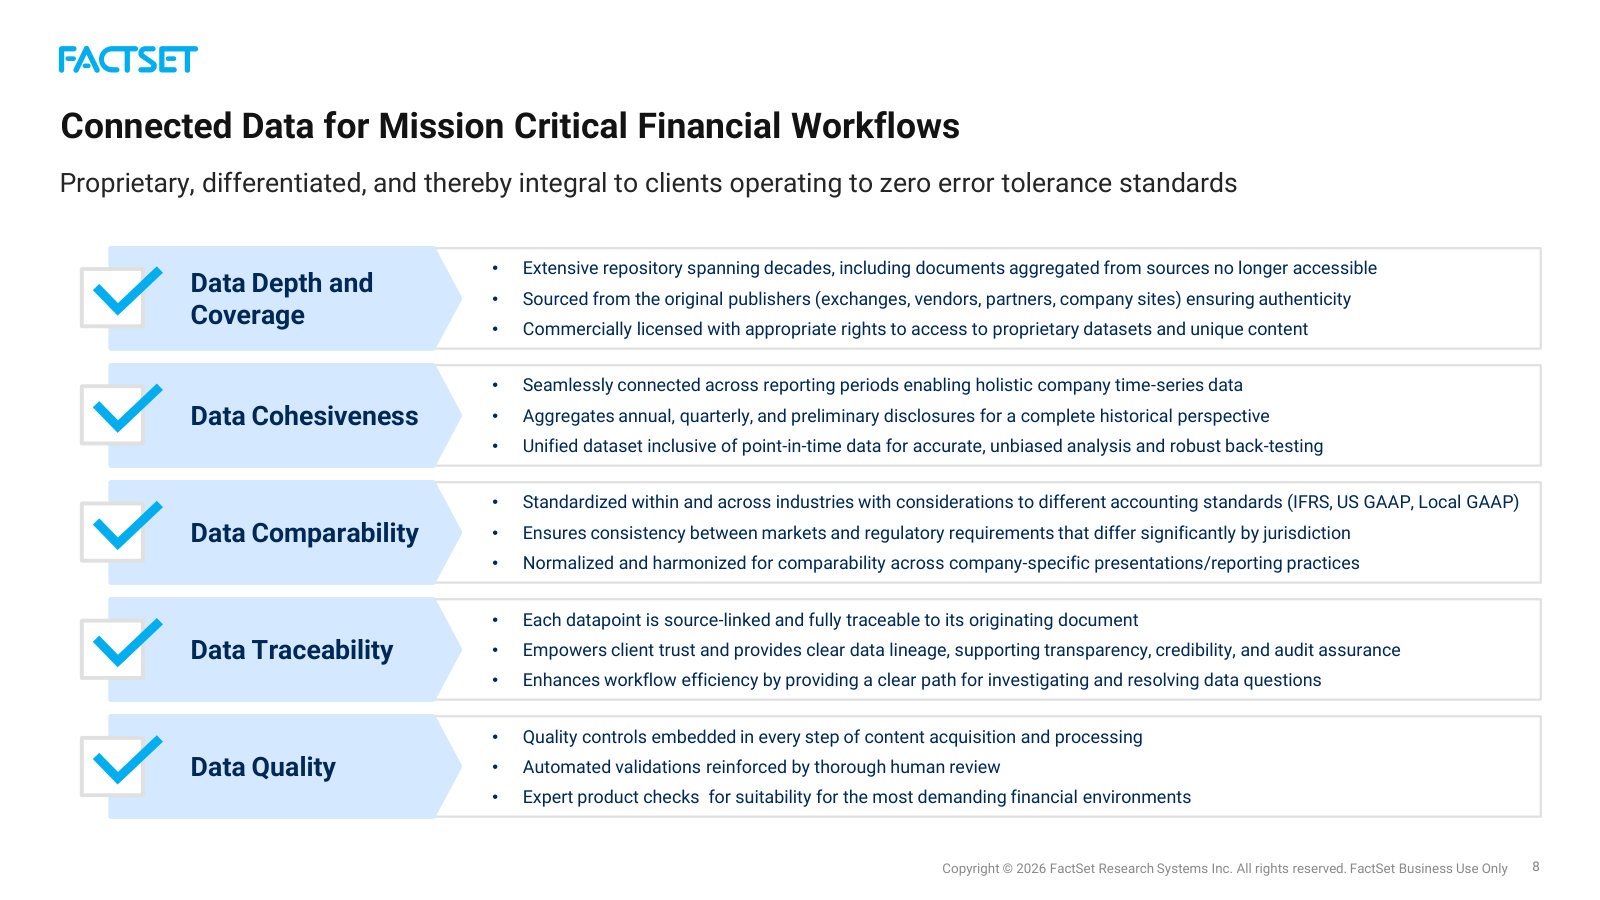
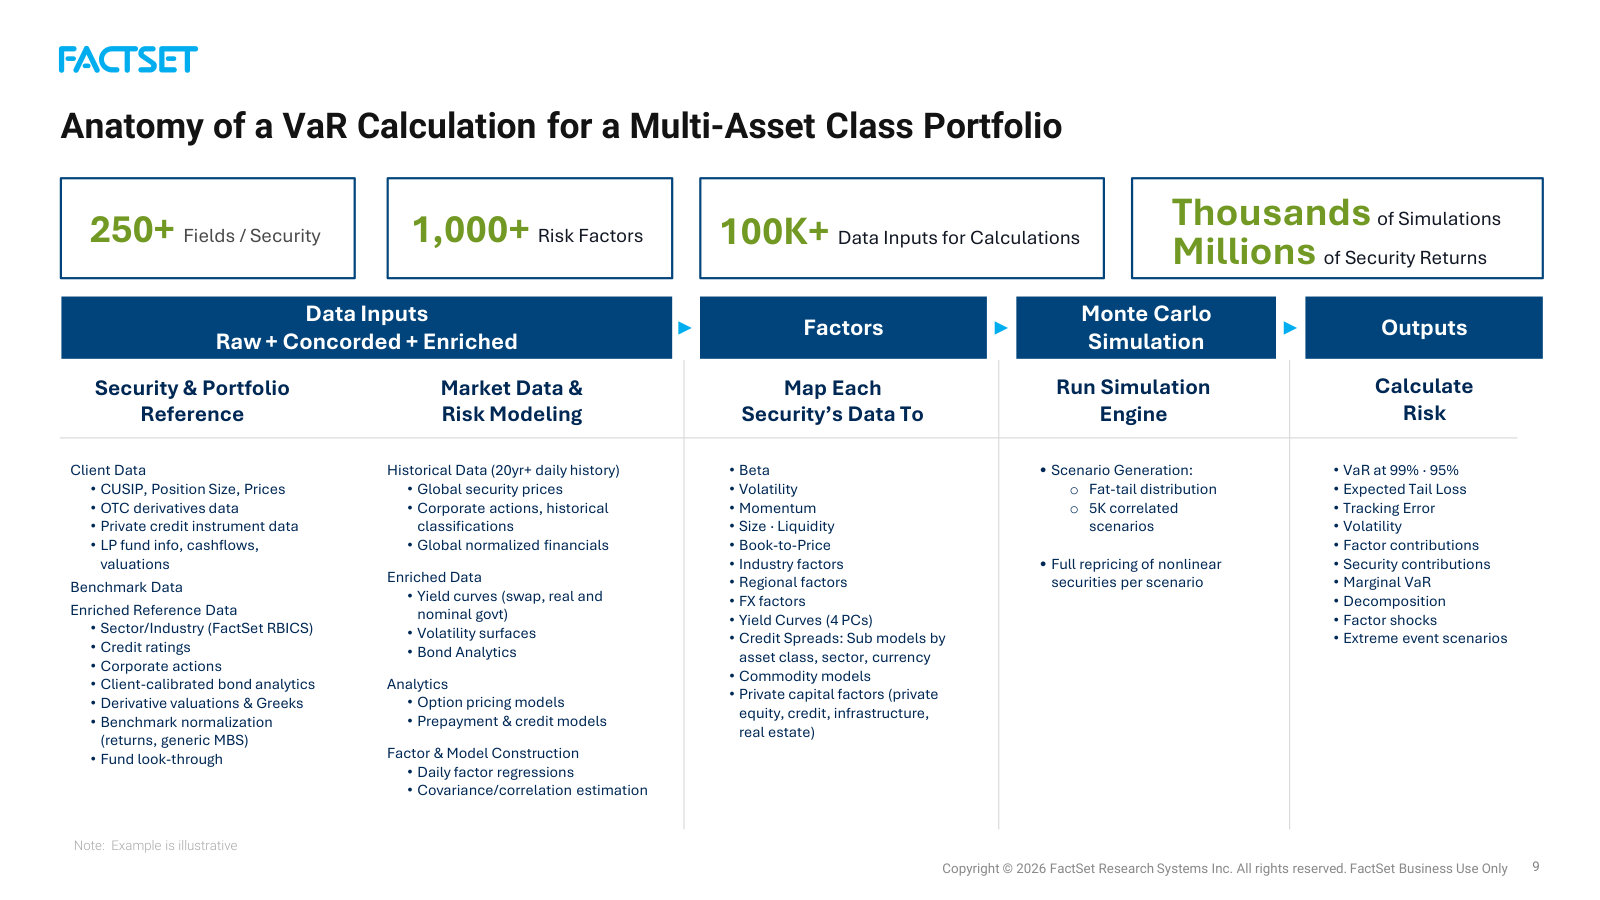
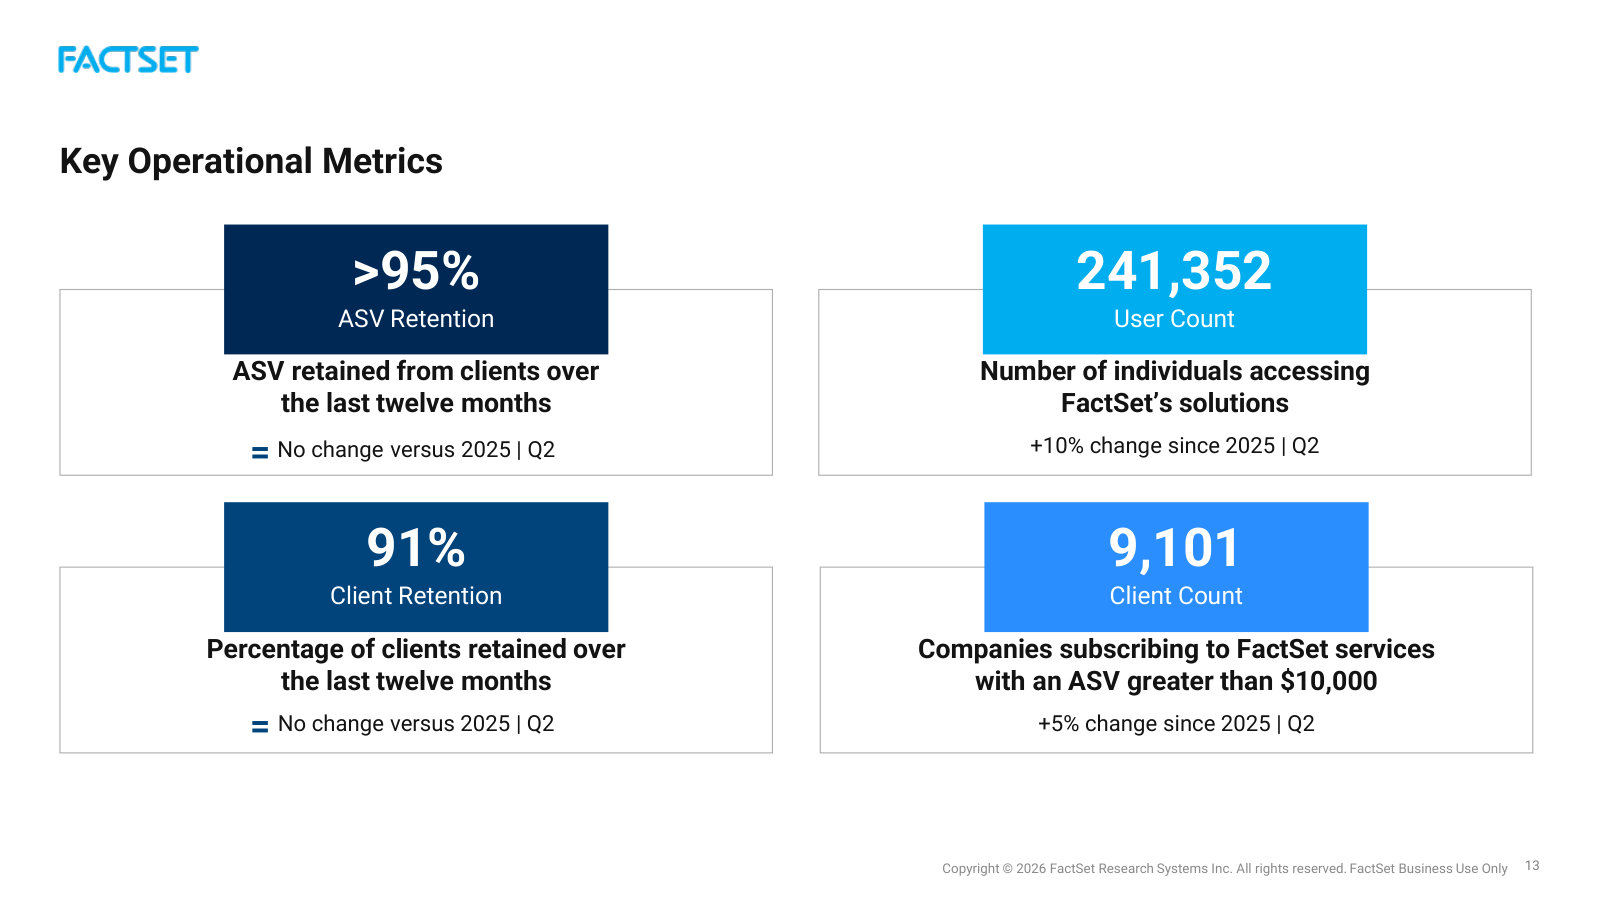
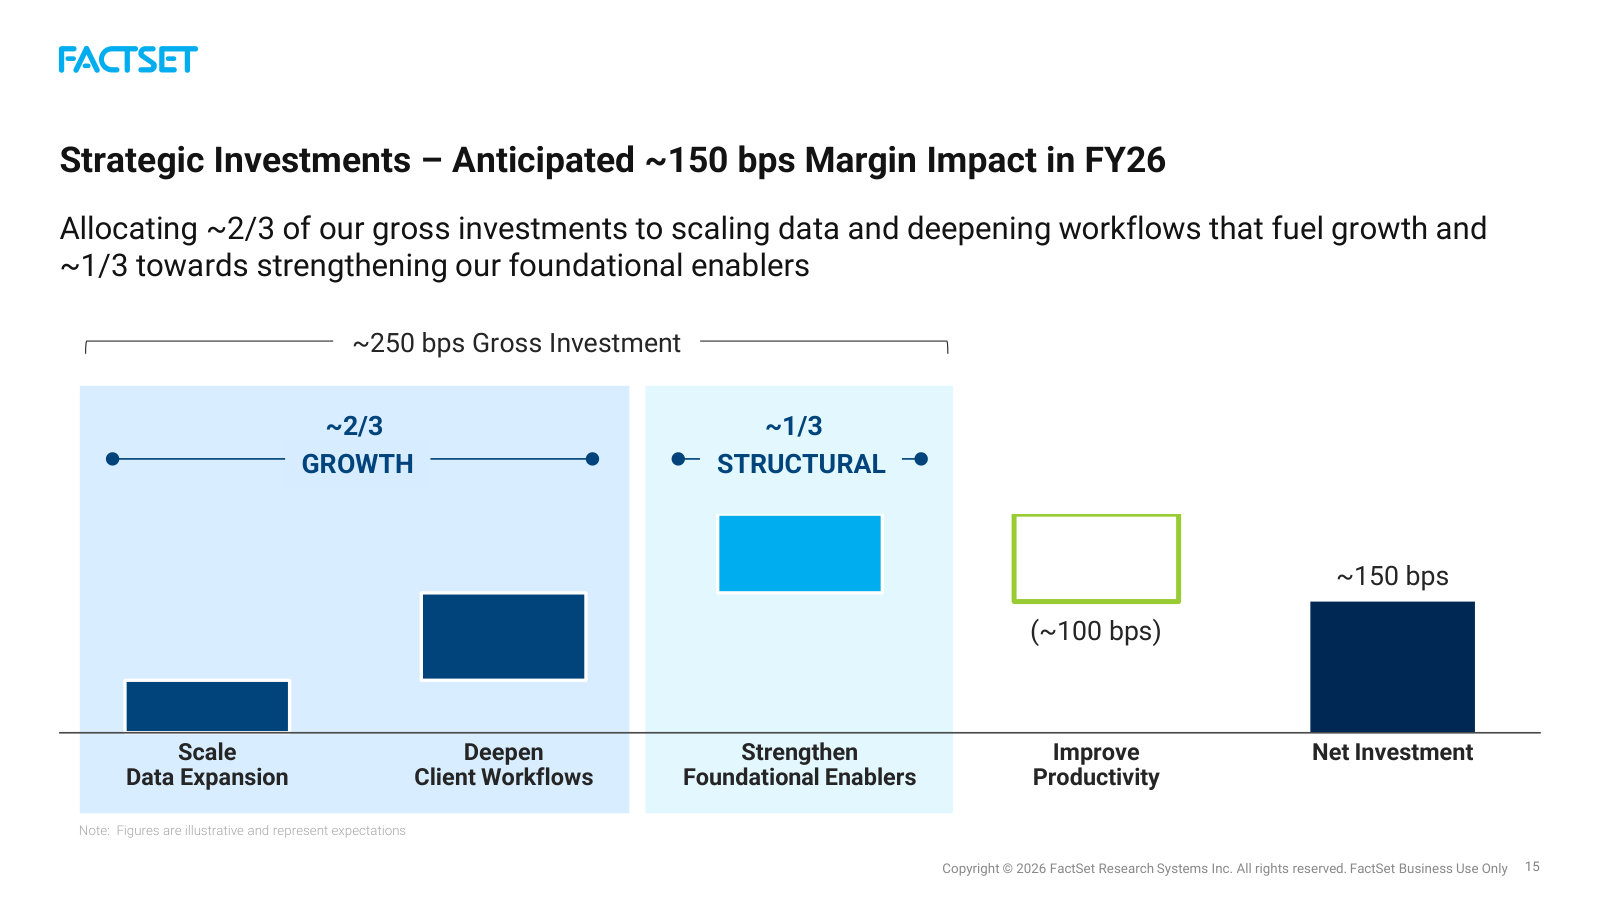
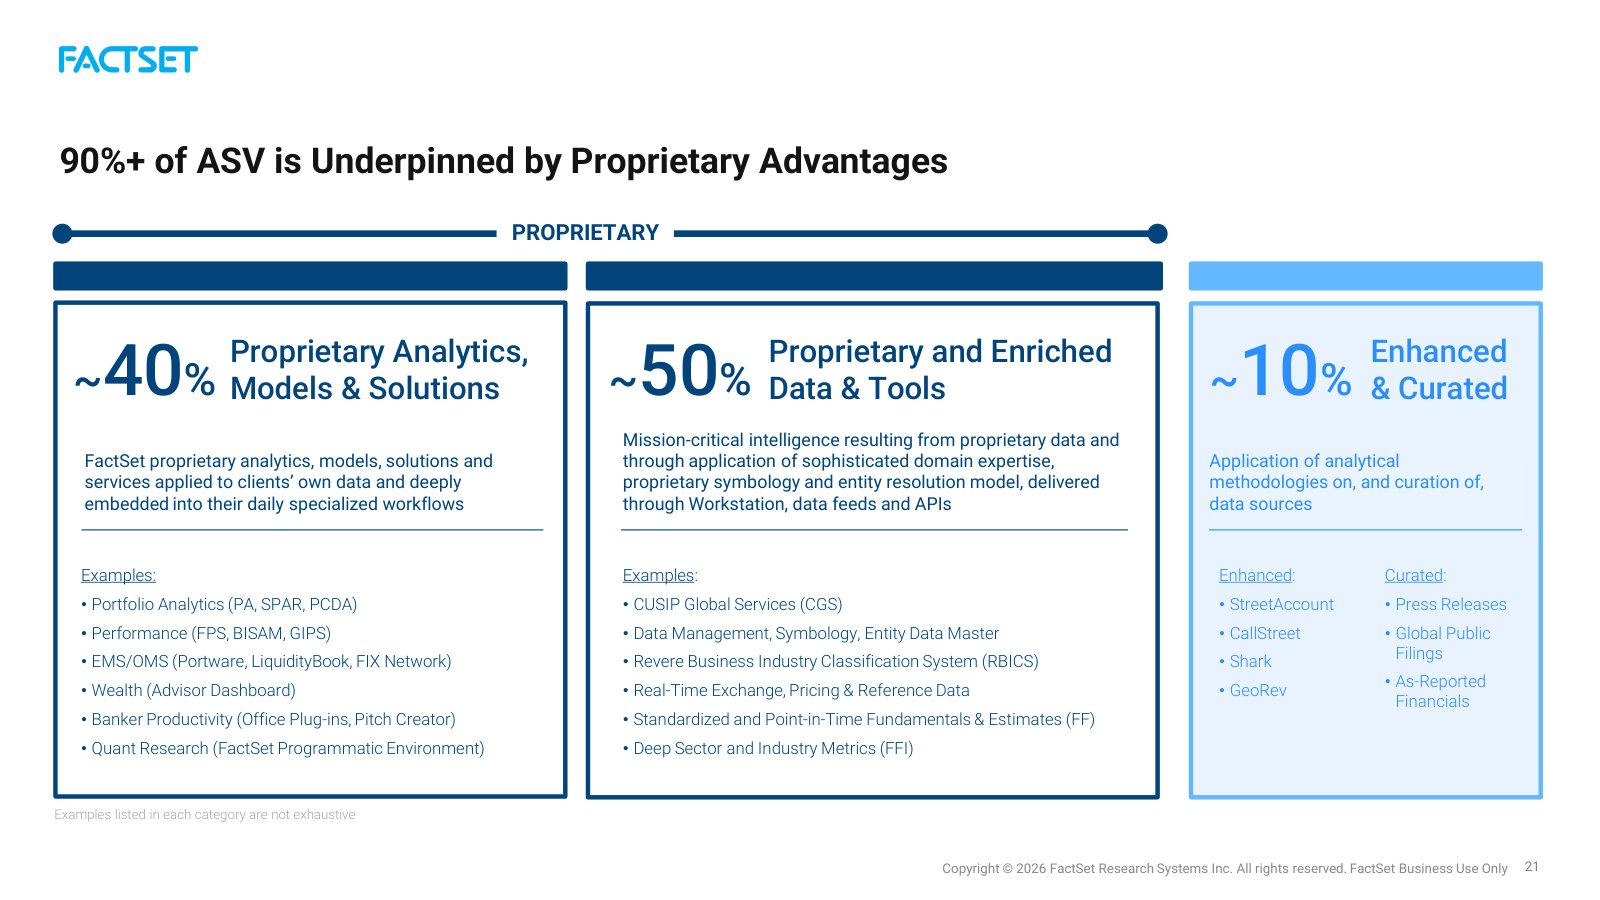
Explains the moat and the FY26 investment cycle: why the data is hard to leave, how the analytics work, and where money is going. · Open the full document →
More from management
Q1 FY2026 Earnings Presentation — Q1 FY2026 · 25 pages · The first deck of the FY26 strategy reset; introduces the same foundational-strengths and investment framework at the year's start. · Open →
Q4 & Full-Year FY2025 Earnings Presentation — Q4 / FY2025 · 23 pages · Full-year FY2025 results, the multi-decade track record, and the FY2026 outlook that later quarters are measured against. · Open →
FactSet Research Systems Inc.'s annual reports contain management's most considered account of the business. These are the sections, passages and visual pages worth opening in the originals preserved in Sources.
FactSet Research Systems — FY2025 Annual Report (Form 10-K) — FY2025 (year ended Aug 31, 2025)
The latest 10-K: subscription model, the Sep-2025 CEO handoff, and a still-open IT material weakness. · Open the full document →
Item 1. Business — p. 7 · Read the full section →
Management's own framing of the platform, its client base, and the three-segment / firm-type structure.
Self-description: a subscription platform serving ~9,000 clients and over 237,000 professionals.
FactSet is a global financial digital platform and enterprise solutions provider with open and flexible technologies that deliver financial intelligence to investment professionals worldwide. […] As of August 31, 2025, we had approximately 9,000 clients comprised of over 237,000 investment professionals, including institutional asset managers, bankers, wealth managers, asset owners, partners, hedge funds, corporate users, and private equity and venture capital professionals. Our revenues are primarily derived from subscriptions to our multi-asset class data and solutions powered by our connected data and technology platform. Our products and services include workstations, portfolio analytics and enterprise data solutions.
p. 7 · Read in context →
Executive Leadership Transition — p. 11 · Read the full section →
A leadership change dated after fiscal year-end — the reader's first flag of a new strategic hand on the tiller.
Sanoke Viswanathan became CEO on Sep 8, 2025, succeeding retiring Philip Snow.
On September 8, 2025, Sanoke Viswanathan assumed the role of Chief Executive Officer and joined FactSet’s Board of Directors. Mr. Viswanathan succeeds F. Philip Snow, who retired from these roles effective on Mr. Viswanathan's start date. To support a smooth leadership transition, Mr. Snow is continuing employment with FactSet in an advisory capacity until December 31, 2025.
p. 11 · Read in context →
Revenues and Annual Subscription Value ("ASV") — p. 11 · Read the full section →
How FactSet actually makes money — recurring subscriptions measured by ASV, with the retention rate that underpins it.
The Competitive Landscape — p. 12 · Read the full section →
Management names its rivals — useful for sizing the moat against far larger data vendors.
Largest competitors: Bloomberg, S&P Market Intelligence, LSEG (Refinitiv); also Aladdin, MSCI, Morningstar.
Our largest competitors are Bloomberg L.P., S&P's Market Intelligence division, and London Stock Exchange Group's ("LSEG's") Data & Analytics division (formerly known as Refinitiv). Other competitors and competitive products include online database suppliers and integrators and their applications, such as BlackRock Aladdin, MSCI Inc. and Morningstar Inc. Many of these firms provide products or services similar to our offerings.
p. 12 · Read in context →
Item 1A. Risk Factors — p. 21 · Read the full section →
Two structural, company-specific risks that could genuinely bite: AI disruption and the active-to-passive shift.
AI risk: may not generate revenue from AI investment, and rivals may adopt it faster.
We use, and are expanding our use of, machine learning and AI technologies in our products and processes. If we fail to keep pace with rapidly evolving AI technological developments, or fail to launch products that are competitive, our competitive position and business results may be negatively impacted. If our competitors or other third parties incorporate AI technologies, such as emerging generative and agentic AI, into their products and processes more quickly or more successfully than us, this could impair our ability to compete effectively. Our use of AI technologies, including generative and agentic AI, requires resources to develop, test and maintain such products, which is costly. Despite our investments in, and commitment of resources to, the development of AI products and technologies, we may not be successful in generating revenues from these efforts.
p. 25 · Read in context →
A continued shift to passive investing could reduce demand for FactSet's active-manager clients.
A continued shift to passive investing, resulting in an increased outflow to passively managed index funds, could reduce demand for the services of active investment managers[…]
p. 27 · Read in context →
Item 7. Management's Discussion and Analysis of Financial Condition and Results of Operations — p. 45 · Read the full section →
Where management explains what drove fiscal 2025 — revenue, margin and EPS — plus the Organic ASV bridge.
Fiscal 2025: revenue +5.4% to $2,321.7M; net income +11.2%; Diluted EPS $15.55, +11.8%.
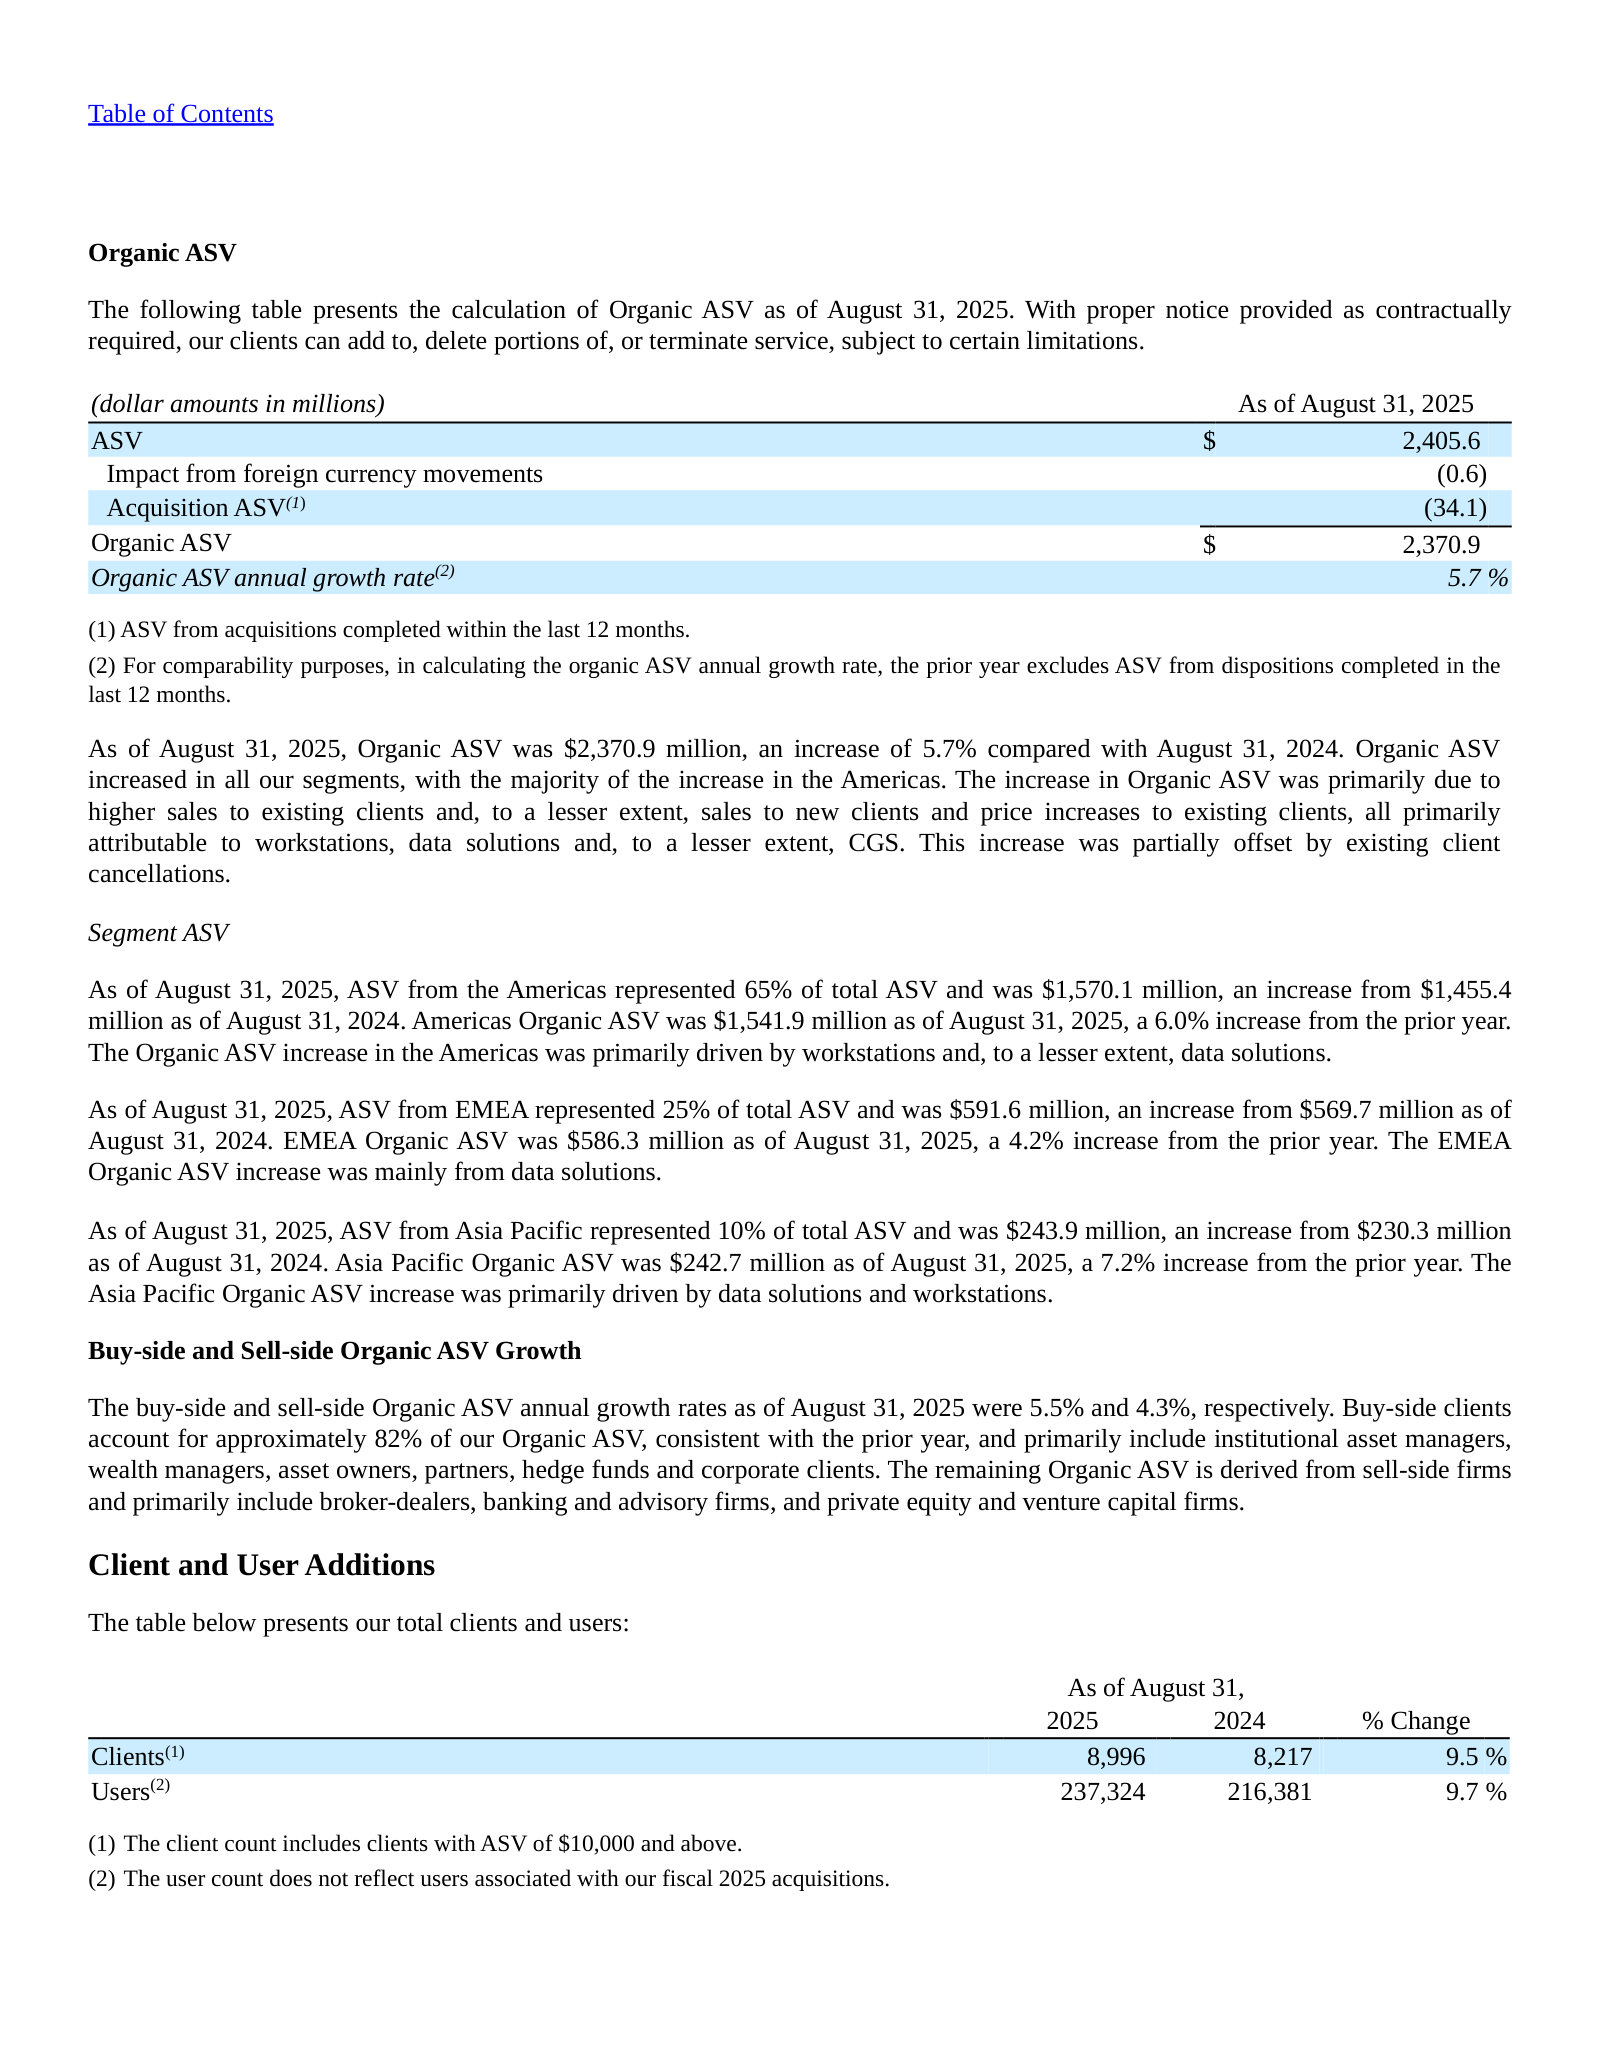
Revenues for fiscal 2025 were $2,321.7 million, an increase of 5.4% from the comparable prior year. The growth in revenues was driven by a 4.4% increase in organic revenues, a 0.9% increase from acquisition-related revenues and a net increase of 0.1% from foreign currency exchange rate fluctuations. Revenues increased in all our segments, primarily in the Americas. […] Net income for fiscal 2025 was $597.0 million, an increase of 11.2% from the prior year. Diluted earnings per common share ("Diluted EPS") for fiscal 2025 was $15.55, an increase of 11.8% compared with the prior year.
p. 47 · Read in context →
Item 9A. Controls and Procedures — p. 141 · Read the full section →
The standout governance flag — disclosure controls were not effective; a prior IT material weakness remains open.
Controls deemed not effective; the FY2024 IT general-controls material weakness continues, not fully remediated.
Our Principal Executive Officer and Principal Financial Officer have concluded that our disclosure controls and procedures were not effective as of the end of the annual period covered by this report due to a material weakness in internal control over financial reporting. This conclusion is due to a material weakness identified in the operation of certain key IT general controls. […] As reported in Part II, Item 9A. “Controls and Procedures” of our Annual Report on Form 10-K for the fiscal year ended August 31, 2024, we had identified a material weakness in the design and operation of IT general controls that support our revenues, accounts receivable, and deferred revenues processes which, in the aggregate, gave rise to a material weakness in internal control over financial reporting. While we have made significant progress remediating those control deficiencies, there remains certain deficiencies related to program change management and monitoring and user access in connection with segregation of duties and restrictions to appropriate users.
p. 141 · Read in context →
FactSet Research Systems — FY2024 Annual Report (Form 10-K) — FY2024 (year ended Aug 31, 2024)
Included to show where the material weakness originated — first disclosed here, with remediation promised for fiscal 2025. · Open the full document →
Item 9A. Controls and Procedures — p. 153 · Read the full section →
The first identification of the IT general-controls material weakness — read against FY2025 to see it left unresolved.
More annual reports
FactSet Research Systems — FY2023 Annual Report (Form 10-K) — FY2023 (year ended Aug 31, 2023) · 153 pages · Pre-material-weakness baseline under the Snow-era strategy and firm-type structure. · Open →
FactSet Research Systems — FY2022 Annual Report (Form 10-K) — FY2022 (year ended Aug 31, 2022) · 162 pages · First full year integrating the CGS (CUSIP Global Services) acquisition. · Open →
FactSet Research Systems — FY2021 Annual Report (Form 10-K) — FY2021 (year ended Aug 31, 2021) · 154 pages · Earliest edition on file — useful anchor for five-year ASV and margin trend. · Open →
Competitors describe FactSet Research Systems Inc.'s market in their own filings and calls. These verified passages and visual pages show where their strategies meet, using source documents preserved in Sources.
S&P Global (SPGI)
The most direct desktop-and-data rival: S&P Capital IQ Pro competes seat-for-seat with the FactSet Workstation, and the two firms are named peers — S&P even sold its CUSIP business to FactSet.
S&P Global's stated view that its Capital IQ Pro desktop is growing faster than the underlying end market — the segment where it contests FactSet Workstation seats.
Martina Cheung, President & CEO: The Capital IQ Pro desktop continues to perform strongly and actually it's growing faster than the end market. And so we're very focused on our execution.
p. 13 · Read in context →
A direct link between the two rivals: S&P Global divested CUSIP Global Services out of its Market Intelligence segment to FactSet for $1.925bn (completed March 2022).
In March of 2022, we completed the previously announced sale of CUSIP Global Services (“CGS”), a business within our Market Intelligence segment, to FactSet Research Systems Inc. for a purchase price of $1.925 billion in cash, subject to customary adjustments.
p. 78 · Read in context →
London Stock Exchange Group (LSEG)
Owner of Refinitiv, whose Workspace desktop and data feeds are the other head-on rival to FactSet's Workstation and content business; LSEG frames itself as a share-taking data challenger.
An analyst's characterisation — undisputed by management — that LSEG has climbed from #6 to #3 in pricing & reference data (55% of Data & Feeds revenue), an adjacent feeds market FactSet also serves.
Russell Quelch, Rothschild & Co (analyst): You disclosed that 55% of the Data & Feeds revenues come from pricing and reference services. I believe you've gone from number 6 player there to number 3 player in the last couple of years, just behind ICE and Bloomberg.
p. 30 · Read in context →
LSEG's CEO concedes its Workspace desktop is priced at roughly a 30% discount to the 'big competitor' terminal — a pricing backdrop for the crowded desktop market FactSet also competes in.
David Schwimmer, CEO: The way I've answered an aspect of this question over the years, people ask us about the discount of, for example, our desktop product or Workspace relative to one of the big competitors and that being at a 30% or so discount, and we've always been clear we're never going to take the price up 29% in the new year.
p. 46 · Read in context →
LSEG's stated Microsoft-partnership roadmap: embedding Workspace data into Teams and Office 365 workflows via natural-language prompts — the same AI-plus-workflow terrain FactSet is targeting.
The first iteration of our Workspace for Teams application is now live with target customers, and we will be adding new functionalities and expanding the customer rollout over time. Integrating Workspace data into Teams enhances the discoverability of our data and insights by making them accessible in customers’ existing Office 365 workflow. Using simple prompts in Teams Chat, users can call up 20 different data sets with insights on bonds, equities, news, M&A league tables and so on, and share this information with ease.
p. 27 · Read in context →
MSCI (MSCI)
Names FactSet directly as an Analytics competitor; its Barra risk models and multi-asset portfolio analytics collide with FactSet's analytics and risk franchise.
MSCI's 10-K names FactSet Research Systems among the rivals to its Analytics business — an explicit head-to-head acknowledgement in multi-asset risk and portfolio analytics.
Analytics. Our Analytics offerings compete with those from a range of competitors, including Axioma (part of SimCorp), BlackRock Solutions, Bloomberg, and FactSet Research Systems Inc. Additionally, some of the larger broker-dealers have developed proprietary analytics tools for their clients.
p. 19 · Read in context →
MSCI quantifies momentum in the FactSet-competing Analytics segment: high-single-digit run-rate growth and new recurring sales up 30% year-over-year, with enterprise risk and performance wins.
Andy Wiechmann, CFO: In Analytics, run rate growth was in the high single digits, driven by new recurring sales of $17 million, which grew 30% from a year ago. We saw continued strength in equity Analytics, and we had some large enterprise risk and performance wins.
p. 3 · Read in context →
MSCI's stated workflow-lock-in narrative — Barra equity-factor and enterprise risk tools 'deeply embedded' in hedge-fund workflows — the retention story that most directly rivals FactSet's analytics value proposition.
Baer Pettit, President & COO: we see ongoing strong demand from hedge funds for MSCI's equity factor and enterprise risk and performance solutions, which have become deeply embedded in many clients' investment workflows. For example, MSCI closed a 7-figure renewal deal with one of the world's largest hedge funds in which our contribution to their alpha generation and risk management is central.
p. 2 · Read in context →
Morningstar (MORN)
Names FactSet as a competitor across three fronts — the Morningstar Direct workstation, PitchBook private-market data, and Advisor Workstation — the closest multi-product mirror of FactSet's desktop-and-data model.
Morningstar lists FactSet (Cognity and SPAR) among the primary global competitors to Morningstar Direct, its multi-asset analysis and reporting workstation — the direct analogue to the FactSet Workstation.
Its key global competitors are Bloomberg, eVestment Alliance, FactSet Research System’s Cognity and SPAR, and LSEG's (Refinitiv) Eikon.
p. 7 · Read in context →
In private-market data and workflow tools (PitchBook), Morningstar again names FactSet among key competitors; the same page discloses ~10,200 client accounts and 113,451 licensed users at year-end 2025.
We compete with providers of private market data, research, and workflow tools. Key competitors include Beauhurst, FactSet, MSCI, Preqin (a division of BlackRock), Refinitiv, S&P Global Market Intelligence, and smaller or specialized data providers.
p. 11 · Read in context →
For its advisor-facing workstation (reaching 170,000+ advisors across 225+ firms in the US and Canada), Morningstar again lists FactSet among competitors.
Morningstar Advisor Workstation is offered in the US and Canada, reaching more than 225 firms and 170,000 advisors. […] Competitors for Morningstar Advisor Workstation include CapIntel, FactSet, Kwanti, Nitrogen (formerly known as Riskalyze), and YCharts.
p. 9 · Read in context →
Moody's (MCO)
Through the Moody's Analytics segment — research, data and cloud workflow tools sold on a subscription/ARR model — Moody's competes for the same research-feed and analytics budgets as FactSet.
Moody's Analytics sizes its recurring book at $3.6bn ARR (+8% YoY) with mid-to-high-single-digit growth across research and data lines — the subscription model that overlaps FactSet's ASV base.
Noemie Heuland, CFO: ARR ended Q1 at $3.6 billion, up 8% year-over-year. Decision Solutions continues to be a key growth engine for MA, representing approximately 44% of total MA ARR and delivering 10% ARR growth.
p. 3 · Read in context →
Moody's reports a 97% trailing-12-month retention rate framed as workflow embeddedness — the same high-renewal moat FactSet claims for its own subscription base.
Robert Fauber, CEO: That growth was also supported by our trailing 12-month retention rate of 97%, which reflects how embedded we are in customers' workflows as what they call their primary view of risk.
p. 2 · Read in context →
BlackRock (BLK)
Competes with FactSet solely through its Aladdin technology platform — end-to-end portfolio and risk analytics sold to institutions — a far larger tech-ARR franchise overlapping FactSet's analytics and workflow offering.
BlackRock's stated Aladdin roadmap — GenAI 'AI copilots,' open ecosystem connectivity and whole-portfolio public/private analytics — maps onto the vectors where Aladdin encroaches on FactSet's analytics and workflow domain.
Investments in Aladdin AI copilots, enhancements in openness supporting ecosystem partnerships, and advancing whole portfolio solutions including private markets and digital assets are expected to further augment the value of using Aladdin.
p. 54 · Read in context →
More peer documents
S&P Global FY2025 10-K — Market Intelligence segment & M&A — 220 pages · Market Intelligence described as 'multi-asset-class data and analytics integrated with purpose-built workflow solutions'; lists the Capital IQ Pro build-out (Visible Alpha, ChartIQ, ProntoNLP) and names FactSet in the stock-performance peer group (p.58). · Open →
S&P Global Q2 FY2025 call — competitive displacements & retention — 16 pages · Cheung reports net renewal rate up >1pt YoY, a Barclays enterprise deal 'powered by Capital IQ Pro,' and Q&A on competitive displacements and Visible Alpha integration. · Open →
Morningstar FY2024 10-K — prior-year FactSet naming — 204 pages · Names FactSet as a rival in market/equity data (p.9) and Morningstar Direct (p.11) with prior-year renewal-rate comparatives, showing the framing is persistent — but note methodology was restated in FY2025. · Open →
Moody's Analytics Q3 FY2025 call — GenAI product build-out — 13 pages · Fauber details 20+ standalone/AI-enabled applications and 50+ domain-specific agents on proprietary data — the GenAI-research push that collides with FactSet's AI roadmap. · Open →
Moody's FY2025 10-K — Analytics segment financials — 197 pages · Moody's Analytics external revenue $3,599m (+9%), split Decision Solutions $1,692m / Research & Insights $995m / Data & Information $912m (p.74) for sizing the FactSet-competing segment. · Open →
BlackRock Q1 FY2026 call — Aladdin + Preqin private-markets push — 12 pages · Fink pitches Aladdin+eFront+Preqin as 'the language of private credit portfolios,' and CFO Small anchors long-term low-to-mid-teens ACV growth — the private-markets-data land grab overlapping FactSet. · Open →
Source: S&P Capital IQ consensus via Xpressfeed · Generated 2026-07-17.
Street snapshot
Sixteen price targets span $210 to $340 (mean $254, median $246.5), a wide band around a stock the Street rates cautiously.
Currency: USD · Scale: money in millions, absolute (per share) · Analyst counts shown explicitly; recommendation respondents: 18.
| Street view | Reading | Analysts |
|---|---|---|
| Recommendation mix | Buy 2, Outperform 0, Hold 10, Underperform 2, Sell 4 | 18 |
| Consensus score | 3.33 | 18 |
| Target price | mean 254.0; high 340.0; low 210.0 | 16 |
Forward table
Consensus carries revenue from FY2025's $2,321.7M actual to roughly $2,769M by FY2028 and normalized EPS from $16.98 to about $21.87, i.e. steady mid-single-digit revenue growth with a faster EPS climb. Gross margin is modeled to ease toward 51% in FY2026 from 53.4% in FY2025.
Currency: USD · Scale: money in millions, absolute (per share) · Analyst count is the estimate count for each period and metric.
| Period | Metric | Mean | YoY | Analysts | Low / high |
|---|---|---|---|---|---|
| FY0E | Revenue | 2,470 | 6.4% | 16 | 2,453 / 2,475 |
| FY0E | EBITDA | 923.4 | -1.2% | 10 | 872.0 / 943.0 |
| FY0E | EBIT | 850.9 | 0.3% | — | — / — |
| FY0E | Net income (GAAP) | 554.0 | -7.2% | 10 | 541.7 / 567.5 |
| FY0E | Net income (normalized) | 654.1 | -0.2% | — | — / — |
| FY0E | EPS (GAAP) | 15.06 | -3.1% | 11 | 14.78 / 15.44 |
| FY0E | EPS (normalized) | 17.81 | 4.9% | 18 | 17.49 / 18.01 |
| FY0E | Free cash flow | 691.3 | 6.1% | — | — / — |
| FY0E | Dividend per share | 4.49 | 5.4% | — | — / — |
| FY0E | Gross margin | 51.3% | -3.9% | — | — / — |
| FY0E | Capital expenditure | -116.2 | 16.7% | — | — / — |
| FY0E | Net debt | 1,057 | -0.5% | — | — / — |
| FY0E | Cash from operations | 809.4 | 5.2% | — | — / — |
| FY0E | ROE | 26.5% | -7.4% | — | — / — |
| FY+1E | Revenue | 2,613 | 5.8% | 16 | 2,575 / 2,634 |
| FY+1E | EBITDA | 998.3 | 8.1% | 10 | 936.4 / 1,046 |
| FY+1E | EBIT | 900.7 | 5.8% | — | — / — |
| FY+1E | Net income (GAAP) | 627.5 | 13.3% | 10 | 604.3 / 649.0 |
| FY+1E | Net income (normalized) | 691.1 | 5.7% | — | — / — |
| FY+1E | EPS (GAAP) | 17.81 | 18.3% | 11 | 16.63 / 18.67 |
| FY+1E | EPS (normalized) | 19.67 | 10.5% | 18 | 18.62 / 20.30 |
| FY+1E | Free cash flow | 711.4 | 2.9% | — | — / — |
| FY+1E | Dividend per share | 4.72 | 5.1% | — | — / — |
| FY+1E | Gross margin | 51.8% | 1.0% | — | — / — |
| FY+1E | Capital expenditure | -127.7 | 9.8% | — | — / — |
| FY+1E | Net debt | 851.2 | -19.4% | — | — / — |
| FY+1E | Cash from operations | 865.8 | 7.0% | — | — / — |
| FY+1E | ROE | 29.9% | 12.9% | — | — / — |
| FY+2E | Revenue | 2,769 | 6.0% | 13 | 2,693 / 2,818 |
| FY+2E | EBITDA | 1,050 | 5.2% | 8 | 947.7 / 1,126 |
| FY+2E | EBIT | 953.8 | 5.9% | — | — / — |
| FY+2E | Net income (GAAP) | 685.4 | 9.2% | 7 | 645.4 / 712.0 |
| FY+2E | Net income (normalized) | 736.9 | 6.6% | — | — / — |
| FY+2E | EPS (GAAP) | 19.96 | 12.1% | 8 | 17.77 / 20.82 |
| FY+2E | EPS (normalized) | 21.87 | 11.2% | 14 | 19.88 / 23.17 |
| FY+2E | Free cash flow | 748.3 | 5.2% | — | — / — |
| FY+2E | Dividend per share | 4.94 | 4.8% | — | — / — |
| FY+2E | Gross margin | 51.7% | -0.2% | — | — / — |
| FY+2E | Capital expenditure | -136.1 | 6.6% | — | — / — |
| FY+2E | Net debt | 818.4 | -3.9% | — | — / — |
| FY+2E | Cash from operations | 929.6 | 7.4% | — | — / — |
| FY+2E | ROE | 32.1% | 7.2% | — | — / — |
| Q4 FY2026 | Revenue | 629.2 | 5.4% | 14 | 625.8 / 633.6 |
| Q4 FY2026 | EBITDA | 231.3 | -5.4% | 7 | 219.6 / 241.0 |
| Q4 FY2026 | EBIT | 206.9 | -0.3% | — | — / — |
| Q4 FY2026 | Net income (GAAP) | 139.0 | -9.5% | 8 | 129.3 / 153.8 |
| Q4 FY2026 | Net income (normalized) | 155.0 | -1.3% | — | — / — |
| Q4 FY2026 | EPS (GAAP) | 3.91 | -3.0% | 9 | 3.62 / 4.29 |
| Q4 FY2026 | EPS (normalized) | 4.34 | 7.1% | 16 | 4.14 / 4.52 |
| Q4 FY2026 | Free cash flow | 166.4 | -6.8% | — | — / — |
| Q4 FY2026 | Dividend per share | 1.14 | 3.6% | — | — / — |
| Q4 FY2026 | Gross margin | 51.1% | -3.7% | — | — / — |
| Q4 FY2026 | Capital expenditure | -28.83 | 12.3% | — | — / — |
| Q4 FY2026 | Net debt | 1,008 | — | — | — / — |
| Q4 FY2026 | ROE | 27.7% | 6.1% | — | — / — |
| Q4 FY2026 | Cash from operations | 207.5 | -8.5% | — | — / — |
| Q1 FY2027 | Revenue | 643.2 | 5.9% | 12 | 637.8 / 649.4 |
| Q1 FY2027 | EBITDA | 252.6 | 2.0% | 6 | 243.4 / 259.0 |
| Q1 FY2027 | EBIT | 228.2 | 6.7% | — | — / — |
| Q1 FY2027 | Net income (GAAP) | 156.8 | 2.8% | 6 | 150.5 / 162.2 |
| Q1 FY2027 | Net income (normalized) | 173.5 | 5.2% | — | — / — |
| Q1 FY2027 | EPS (GAAP) | 4.46 | 9.8% | 7 | 4.28 / 4.64 |
| Q1 FY2027 | EPS (normalized) | 4.94 | 9.5% | 15 | 4.75 / 5.14 |
| Q1 FY2027 | Free cash flow | 124.6 | 2.4% | — | — / — |
| Q1 FY2027 | Dividend per share | 1.15 | 2.5% | — | — / — |
| Q1 FY2027 | Gross margin | 52.5% | -1.5% | — | — / — |
| Q1 FY2027 | Capital expenditure | -29.44 | 8.1% | — | — / — |
| Q1 FY2027 | Net debt | 893.5 | — | — | — / — |
| Q1 FY2027 | ROE | 30.8% | 13.5% | — | — / — |
| Q1 FY2027 | Cash from operations | 137.5 | -5.6% | — | — / — |
| Q2 FY2027 | Revenue | 647.0 | 5.9% | 12 | 641.2 / 650.7 |
| Q2 FY2027 | EBITDA | 248.9 | 14.3% | 6 | 236.5 / 258.0 |
| Q2 FY2027 | EBIT | 223.5 | 4.3% | — | — / — |
| Q2 FY2027 | Net income (GAAP) | 154.6 | 16.2% | 6 | 148.5 / 160.8 |
| Q2 FY2027 | Net income (normalized) | 169.9 | 4.6% | — | — / — |
| Q2 FY2027 | EPS (GAAP) | 4.43 | 23.3% | 7 | 4.25 / 4.67 |
| Q2 FY2027 | EPS (normalized) | 4.90 | 9.8% | 15 | 4.68 / 5.07 |
| Q2 FY2027 | Free cash flow | 179.4 | 8.4% | — | — / — |
| Q2 FY2027 | Dividend per share | 1.15 | 4.4% | — | — / — |
| Q2 FY2027 | Gross margin | 51.5% | -1.1% | — | — / — |
| Q2 FY2027 | Capital expenditure | -27.76 | -3.2% | — | — / — |
| Q2 FY2027 | Net debt | 712.9 | -30.4% | — | — / — |
| Q2 FY2027 | ROE | 29.2% | 7.5% | — | — / — |
| Q2 FY2027 | Cash from operations | 218.9 | 8.3% | — | — / — |
| Q3 FY2027 | Revenue | 659.3 | 5.8% | 12 | 653.8 / 664.5 |
| Q3 FY2027 | EBITDA | 250.3 | 17.1% | 6 | 233.5 / 270.3 |
| Q3 FY2027 | EBIT | 226.2 | 5.6% | — | — / — |
| Q3 FY2027 | Net income (GAAP) | 155.1 | 22.4% | 6 | 145.9 / 160.0 |
| Q3 FY2027 | Net income (normalized) | 171.9 | 5.4% | — | — / — |
| Q3 FY2027 | EPS (GAAP) | 4.48 | 27.9% | 7 | 4.23 / 4.75 |
| Q3 FY2027 | EPS (normalized) | 4.93 | 8.9% | 15 | 4.70 / 5.15 |
| Q3 FY2027 | Free cash flow | 207.2 | -0.2% | — | — / — |
| Q3 FY2027 | Dividend per share | 1.17 | 2.8% | — | — / — |
| Q3 FY2027 | Gross margin | 50.6% | -1.3% | — | — / — |
| Q3 FY2027 | Capital expenditure | -29.56 | 11.7% | — | — / — |
| Q3 FY2027 | Net debt | 570.0 | -44.9% | — | — / — |
| Q3 FY2027 | Cash from operations | 265.1 | 13.6% | — | — / — |
| Q3 FY2027 | ROE | 28.0% | 1.1% | — | — / — |
Estimate momentum
Out-year consensus has firmed over the past 180 days: FY2027 revenue moved from $2,578.8M to $2,613.0M and normalized EPS from $19.01 to $19.67, with FY2028 estimates similarly higher. The revisions are broad across both years and metrics but modest in size.
Currency: USD · Scale: money in millions, absolute (per share) · Point-in-time consensus; analyst count is shown where supplied.
| Period | Metric | Lookback | Then | Now | Direction / magnitude | Analysts |
|---|---|---|---|---|---|---|
| 2027 | Revenue | 30d | 2,604 | 2,613 | up 0.4% | — |
| 2027 | Revenue | 90d | 2,603 | 2,613 | up 0.4% | — |
| 2027 | Revenue | 180d | 2,579 | 2,613 | up 1.3% | — |
| 2028 | EPS (normalized) | 30d | 21.44 | 21.87 | up 2.0% | — |
| 2028 | EPS (normalized) | 90d | 21.48 | 21.87 | up 1.8% | — |
| 2028 | EPS (normalized) | 180d | 20.95 | 21.87 | up 4.4% | — |
| 2028 | Revenue | 30d | 2,755 | 2,769 | up 0.5% | — |
| 2028 | Revenue | 90d | 2,754 | 2,769 | up 0.5% | — |
| 2028 | Revenue | 180d | 2,725 | 2,769 | up 1.6% | — |
| 2027 | EPS (normalized) | 30d | 19.39 | 19.67 | up 1.5% | — |
| 2027 | EPS (normalized) | 90d | 19.42 | 19.67 | up 1.3% | — |
| 2027 | EPS (normalized) | 180d | 19.01 | 19.67 | up 3.5% | — |
Beat / miss record
Revenue has topped consensus in seven of the last eight quarters, the exception a fractional FY2025 Q2 miss.
Current sequences by metric: Revenue: 5 consecutive beats; EPS (normalized): 3 consecutive beats.
Currency: USD · Scale: money in millions, absolute (per share) · Consensus is captured before each actual first became effective; analyst count shown per observation.
| Quarter | Metric | Consensus as of | Actual | Surprise | Outcome | Analysts |
|---|---|---|---|---|---|---|
| Q3 FY2026 | Revenue | 618.1 | 622.9 | 0.8% | Beat | — |
| Q3 FY2026 | EPS (normalized) | 4.45 | 4.53 | 1.8% | Beat | — |
| Q2 FY2026 | Revenue | 604.9 | 611.0 | 1.0% | Beat | — |
| Q2 FY2026 | EPS (normalized) | 4.38 | 4.46 | 1.9% | Beat | — |
| Q1 FY2026 | Revenue | 600.6 | 607.6 | 1.2% | Beat | — |
| Q1 FY2026 | EPS (normalized) | 4.36 | 4.51 | 3.5% | Beat | — |
| Q4 FY2025 | Revenue | 593.4 | 596.9 | 0.6% | Beat | — |
| Q4 FY2025 | EPS (normalized) | 4.13 | 4.05 | -1.9% | Miss | — |
| Q3 FY2025 | Revenue | 580.9 | 585.5 | 0.8% | Beat | — |
| Q3 FY2025 | EPS (normalized) | 4.30 | 4.27 | -0.6% | Miss | — |
| Q2 FY2025 | Revenue | 570.7 | 570.7 | -0.0% | Miss | — |
| Q2 FY2025 | EPS (normalized) | 4.18 | 4.28 | 2.4% | Beat | — |
| Q1 FY2025 | Revenue | 565.0 | 568.7 | 0.6% | Beat | — |
| Q1 FY2025 | EPS (normalized) | 4.28 | 4.37 | 2.2% | Beat | — |
| Q4 FY2024 | Revenue | 546.8 | 562.2 | 2.8% | Beat | — |
| Q4 FY2024 | EPS (normalized) | 3.62 | 3.74 | 3.3% | Beat | — |
Where the street disagrees
Disagreement concentrates in the thinly-covered out-years: FY2029 rests on just five revenue estimates, five normalized-EPS estimates (stddev $1.58) and a single EBITDA mark, so those spreads carry a weak signal.
Currency: USD · Scale: money in millions, absolute (per share) · Dispersion is high-low divided by absolute mean; analyst count shown per item.
| Period | Metric | Mean | Low | High | Spread / mean | Analysts |
|---|---|---|---|---|---|---|
| 2029 | EPS (GAAP) | 21.99 | 18.83 | 23.80 | 22.6% | 4 |
| 2029 | EPS (normalized) | 23.96 | 21.04 | 25.55 | 18.8% | 5 |
| Q4 FY2026 | Net income (GAAP) | 139.0 | 129.3 | 153.8 | 17.6% | 8 |
| Q4 FY2026 | EPS (GAAP) | 3.91 | 3.62 | 4.29 | 17.2% | 9 |
| 2028 | EBITDA | 1,050 | 947.7 | 1,126 | 17.0% | 8 |
Source: Visible Alpha consensus via S&P Xpressfeed · Consensus as of 2026-07-15 · generated 2026-07-17.
Model trust
Base currency: USD · VA scales normalized from Abs, M; item currencies and units retained · Coverage depth and vintage; broker count is the maximum represented.
| Brokers | Line items | Last revision |
|---|---|---|
| 16 | 361 | 2026-07-15 |
Operating KPIs
Base currency: USD · VA scales normalized from Abs, M; item currencies and units retained · FY-1A / FY0E / FY+1E; broker count shown per KPI.
| Operating KPI | Source | FY-1A | FY0E | FY+1E | Brokers |
|---|---|---|---|---|---|
| Depreciation and amortization | CD | 153,841.11bn Amount | 177,402.88bn Amount | 177,704.91bn Amount | 16 |
| Depreciation and amortization exp | CD | 154,141.50bn Amount | 177,402.69bn Amount | 177,704.91bn Amount | 16 |
| Dividend payments | CD | 163,290.08bn Amount | 164,682.67bn Amount | 168,114.01bn Amount | 16 |
| Long-term debt | CD | 1,362,454.00bn Amount | 1,084,222.25bn Amount | 1,046,872.25bn Amount | 16 |
| Net cash provided by/(used in) operating activities | CD | 779,452.70bn Amount | 810,713.12bn Amount | 865,740.18bn Amount | 16 |
| Purchases of property, equipment and leasehold improvements, net | CD | 99,403.55bn Amount | 118,981.64bn Amount | 121,040.77bn Amount | 16 |
| Repurchase of common stock | CD | 280,503.40bn Amount | 620,891.64bn Amount | 451,423.22bn Amount | 16 |
| Revenues | CD | 2,318,235.05bn Amount | 2,470,577.65bn Amount | 2,615,364.10bn Amount | 16 |
| Stock-based compensation expense | CD | 62,321.34bn Amount | 79,216.43bn Amount | 82,358.84bn Amount | 16 |
| Cash and cash equivalents | CD | 511,030.29bn Amount | 301,692.75bn Amount | 470,740.56bn Amount | 15 |
| Cost of services | CD | 1,090,097.57bn Amount | 1,206,073.75bn Amount | 1,266,689.18bn Amount | 15 |
| Free cash flow (FCF) | CD | 673,991.84bn Amount | 695,263.99bn Amount | 746,677.31bn Amount | 15 |
P&L bridge
Base currency: USD · VA scales normalized from Abs, M; item currencies and units retained · Margins are derived against revenue; YoY compares adjacent fiscal columns; broker count shown per line.
| P&L line | FY-1A | FY0E | FY+1E | Brokers |
|---|---|---|---|---|
| Revenue | 2,318,235.05bn Amount | 2,470,577.65bn Amount (6.6% YoY) | 2,615,364.10bn Amount (5.9% YoY) | 16 |
| Gross Profit | 1,228,157.31bn Amount (53.0% margin) | 1,264,537.12bn Amount (51.2% margin; 3.0% YoY) | 1,347,656.89bn Amount (51.5% margin; 6.6% YoY) | 15 |
| Ebitda | 984,743.24bn Amount (42.5% margin) | 1,007,006.91bn Amount (40.8% margin; 2.3% YoY) | 1,062,597.21bn Amount (40.6% margin; 5.5% YoY) | 15 |
| Operating Income | 849,630.19bn Amount (36.6% margin) | 848,704.63bn Amount (34.4% margin; -0.1% YoY) | 896,138.16bn Amount (34.3% margin; 5.6% YoY) | 16 |
| Net Income | 655,351.83bn Amount (28.3% margin) | 654,334.08bn Amount (26.5% margin; -0.2% YoY) | 690,116.96bn Amount (26.4% margin; 5.5% YoY) | 16 |
| Eps | 17.08 Amount | 17.83 Amount (4.4% YoY) | 19.65 Amount (10.2% YoY) | 16 |
Consensus dispersion
Base currency: USD · VA scales normalized from Abs, M; item currencies and units retained · Top high-low spreads relative to absolute mean; requires at least 3 brokers.
| Line item | Period | Mean | Min | Q1 | Q3 | Max | Spread / mean | Brokers |
|---|---|---|---|---|---|---|---|---|
| Dividend payments | 1QFY-2026 | 55,002.57bn Amount | 41,202.70bn Amount | 41,584.20bn Amount | 42,255.64bn Amount | 198,109.34bn Amount | 285.3% | 12 |
| Stock-based compensation expense | 4QFY-2025 | 14,680.43bn Amount | -17,154.00bn Amount | 17,015.00bn Amount | 17,801.48bn Amount | 21,094.84bn Amount | 260.5% | 12 |
| Cash and cash equivalents | FY-2028 | 596,654.97bn Amount | 138,241.86bn Amount | 374,194.41bn Amount | 770,719.26bn Amount | 1,511,759.93bn Amount | 230.2% | 13 |
| Repurchase of common stock | 2QFY-2026 | 117,240.04bn Amount | 55,000.00bn Amount | 78,851.58bn Amount | 128,238.75bn Amount | 300,000.00bn Amount | 209.0% | 11 |
| Cash and cash equivalents | FY-2027 | 470,740.56bn Amount | 162,163.93bn Amount | 326,307.53bn Amount | 523,327.75bn Amount | 1,032,553.80bn Amount | 184.9% | 14 |
| Cash and cash equivalents | 2QFY-2027 | 355,384.70bn Amount | 214,731.33bn Amount | 262,802.00bn Amount | 399,180.14bn Amount | 740,723.10bn Amount | 148.0% | 10 |
Quarterly path
The ASV organic growth rate steps down modestly across the same quarters, from roughly 6.7% to 5.9%, a gentle deceleration rather than an inflection.
Base currency: USD · VA scales normalized from Abs, M; item currencies and units retained · Next four supplied quarters; final column is maximum broker coverage in the row.
| Quarter | Depreciation and amortization | Depreciation and amortization exp | Dividend payments | Long-term debt | Net cash provided by/(used in) operating activities | Total revenue | EPS Diluted, Applicable to common stockholders($) | Broker coverage |
|---|---|---|---|---|---|---|---|---|
| 4QFY-2026 | 43,140.00bn Amount | 44,261.57bn Amount | 41,929.33bn Amount | 1,059,871.14bn Amount | 193,319.50bn Amount | 629,028.08bn Amount | 4.35 Amount | 16 |
| 1QFY-2027 | 43,402.99bn Amount | 43,655.67bn Amount | 42,168.64bn Amount | 1,022,906.15bn Amount | 163,715.16bn Amount | 641,428.35bn Amount | 4.91 Amount | 16 |
| 2QFY-2027 | 43,549.63bn Amount | 43,870.84bn Amount | 41,322.90bn Amount | 1,021,436.50bn Amount | 212,549.51bn Amount | 646,602.32bn Amount | 4.89 Amount | 15 |
| 3QFY-2027 | 44,243.70bn Amount | 44,537.19bn Amount | 42,341.09bn Amount | 1,008,936.50bn Amount | 272,162.40bn Amount | 659,379.73bn Amount | 4.94 Amount | 15 |
15 stale period values omitted; 1 line item fully removed.
Source: S&P Capital IQ transcripts via Xpressfeed · latest indexed call 2026-07-01 · generated 2026-07-17.
Latest call digest
FactSet Research Systems Inc., Q3 2026 Earnings Call, Jul 01, 2026 · 2026-07-01T13:00:00
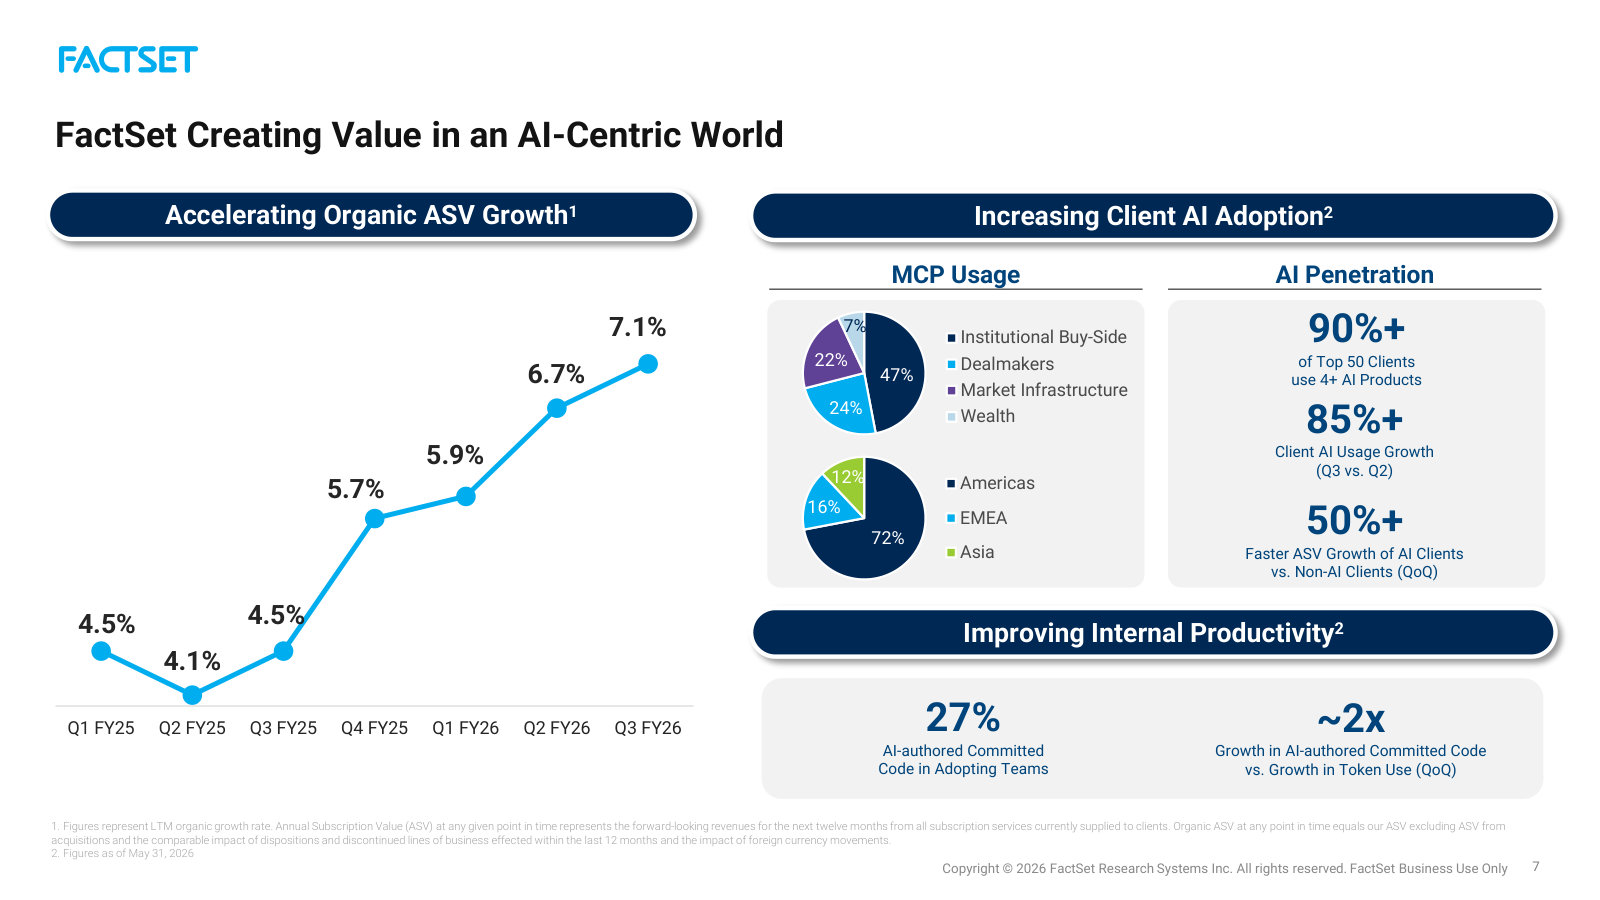
Q3 FY2026 call, July 1, 2026. FactSet reported its fifth straight quarter of accelerating organic ASV growth, up 7.1% to $2.48 billion across all regions and client types, with adjusted operating margin of 34% and adjusted diluted EPS of $4.53 (up 6.1%). This was Sanoke Viswanathan's fourth call as CEO and Joshua Warren's first as CFO, succeeding Helen Shan.
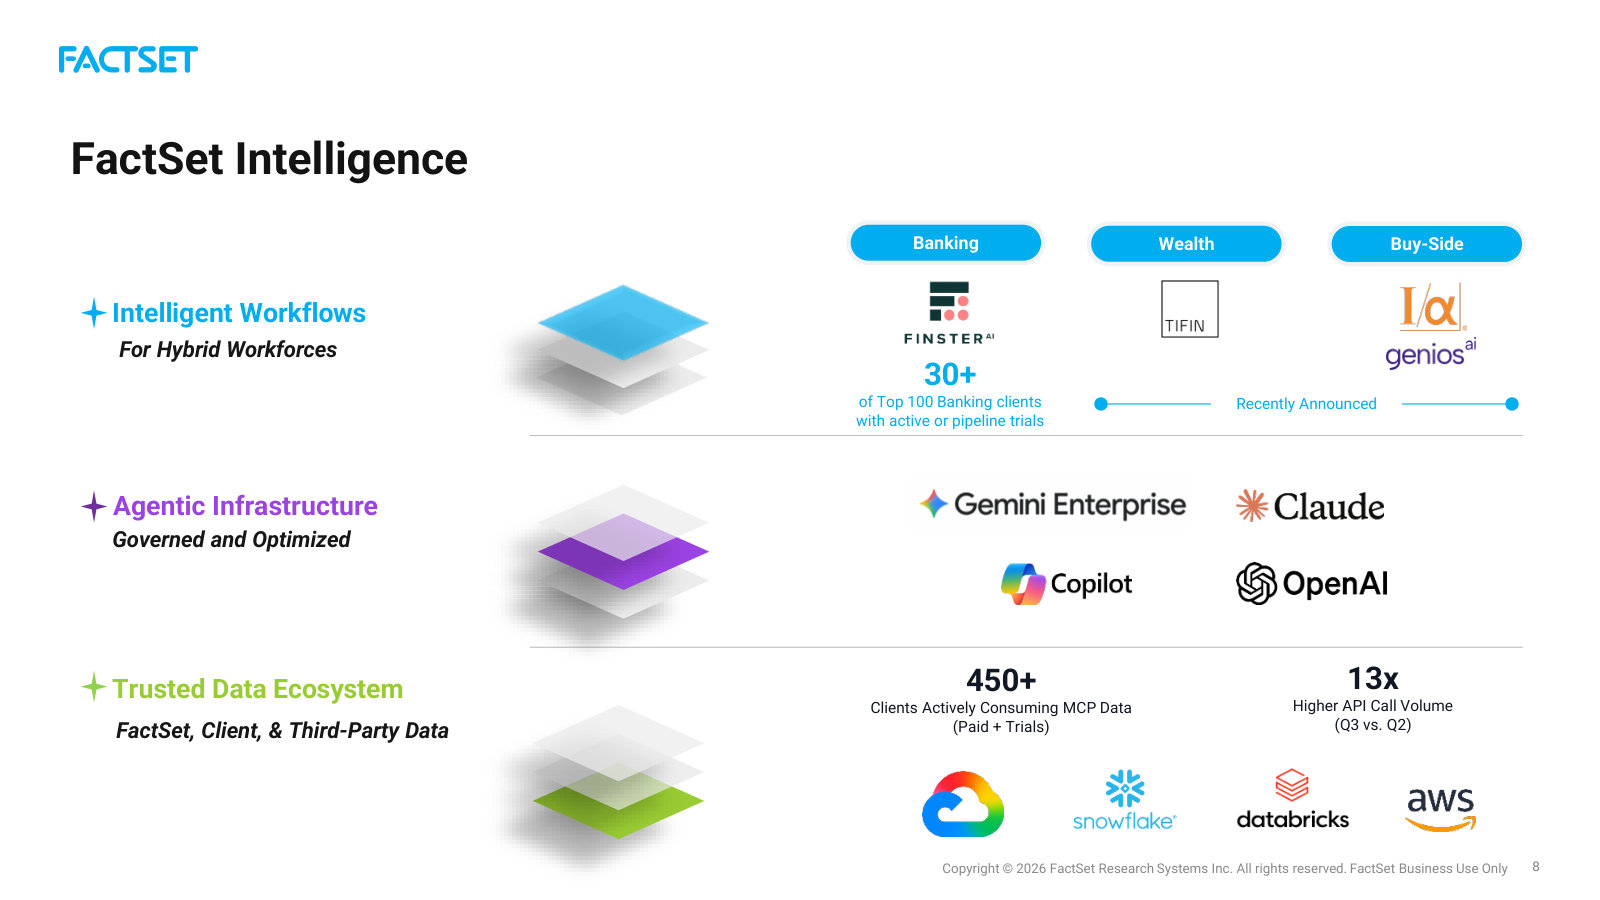
Prepared remarks leaned heavily on AI: over 90% of the top 50 clients now use four or more FactSet AI solutions, ASV growth among AI-adopting clients ran 50% higher than the rest of the book, MCP API call volume hit 13x the prior quarter, and management said more than 10% of ASV growth came directly from AI SKUs. Management also detailed productivity moves — coding agents now author 27% of committed code, and the company initiated a roughly 10% reduction in its technology workforce — alongside a new Google Cloud partnership and the FactSet Intelligence branding.
The Q&A reality was more skeptical. Analysts pressed on the guidance that implies Q4 moderation, on the 300 bp year-over-year margin decline and when leverage returns, on how AI actually monetizes beyond ASV optics, and on the +30% contract-term extension and whether price was traded for length. Management reaffirmed the previously raised FY2026 ranges and said revenue and EPS are tracking toward the high end, attributing the margin dip to performance-linked compensation and deliberate investment rather than headcount growth.
Participant coverage from the latest call.
| Group | Participants | Count |
|---|---|---|
| Management | Operator; Kevin Toomey — Head of Investor Relations, FactSet Research Systems Inc.; Sanoke Viswanathan — CEO & Director, FactSet Research Systems Inc.; Joshua Warren — Chief Financial Officer, FactSet Research Systems Inc. | 4 |
| Analysts | Ashish Sabadra — Analyst, RBC Capital Markets, Research Division; Faiza Alwy — Research Analyst, Deutsche Bank AG, Research Division; Alex Kramm — Executive Director and Equity Research Analyst of Exchanges, Ebrokers, UBS Investment Bank, Research Division; Kelsey Zhu — Financial Information Technology Analyst, Autonomous Research US LP; Manav Patnaik — MD, Business & Information Services Equity Research Analyst., Barclays Bank PLC, Research Division; Shlomo Rosenbaum — Managing Director, Stifel, Nicolaus & Company, Incorporated, Research Division; Surinder Thind — Equity Analyst, Jefferies LLC, Research Division; Yehuda Silverman — Research Associate, Morgan Stanley, Research Division; Andrew Nicholas — Analyst, William Blair & Company L.L.C., Research Division; Keen Fai Tong — Research Analyst, Goldman Sachs Group, Inc., Research Division; Jason Haas — Executive Director & Senior Equity Analyst, Wells Fargo Securities, LLC, Research Division; Curtis Nagle — Vice President, BofA Securities, Research Division | 12 |
Curated latest-call exchanges; one row per analyst topic.
| Analyst | Firm | Topic | What changed in Q&A |
|---|---|---|---|
| Ashish Sabadra | RBC Capital Markets | Guidance implying Q4 moderation | Asked whether the softer implied Q4 is conservatism or reflects specific puts and takes; management cited a tough compare against a record Q4 and reaffirmed guidance without raising it. |
| Faiza Alwy | Deutsche Bank | AI monetization mechanics | Pressed on how AI adoption actually converts to revenue; management pointed to ASV acceleration, MCP-driven upsell and >10% of ASV growth from AI SKUs rather than a discrete AI price. |
| Alex Kramm | UBS | Margin trajectory and one-time items | Questioned whether the midpoint margin target holds and which FY2026 one-off costs roll off into FY2027; management pointed to a clear line of sight on margin improvement but declined FY2027 specifics. |
| Shlomo Rosenbaum | Stifel | Contract-term extension and disclosure | Asked whether the ~30% longer contract terms traded away price and about lock-in risk, plus dropped client/user/employee metrics; management said no price compression and disclosed user count up 12%. |
| Jason Haas | Wells Fargo | Implied margin cadence | Noted the guided rest-of-year margin implies a sharp improvement versus the ~300 bp Q3 decline and asked about comp pull-forward; management framed it as retained flexibility to pay for ASV outperformance. |
| Curtis Nagle | BofA Securities | Token costs and returns | Asked to unpack the token-cost drag on margin and expected returns; CFO called token spend entirely net-new versus 2025 and described controls around routing and budgeting. |
Theme tracker
Themes are curator-classified across supplied calls.
| Theme | Status | Quarters mentioned | Read-through |
|---|---|---|---|
| Organic ASV re-acceleration | persisted | Q4 2025, Q1 2026, Q2 2026, Q3 2026 | Growth has accelerated for five consecutive quarters to 7.1%, reversing the FY2024 deceleration and becoming the central bull point management returns to each call. |
| AI monetization (gen AI to MCP to agentic FactSet Intelligence) | persisted | Q4 2025, Q1 2026, Q2 2026, Q3 2026 | AI moved from an early gen-AI narrative to concrete metrics — MCP launched in December, over 450 MCP clients, and management now credits AI for a rising share of ASV growth. The dominant and intensifying topic. |
| Investment-driven margin compression | persisted | Q4 2025, Q1 2026, Q2 2026, Q3 2026 | Second-half-weighted investment and performance-linked compensation have pressured adjusted operating margin (34% in Q3, down ~300 bp year-over-year); management repeatedly frames it as deliberate and reversible. |
| Shift to enterprise and consumption-based agreements | emerged | Q2 2026, Q3 2026 | Management describes a move away from seat-linked contracts toward multi-year enterprise agreements with minimum commitments and consumption upside; contract terms extended ~30% in Q3. Newer framing tied to the AI transition. |
| AI-driven productivity and workforce reduction | emerged | Q2 2026, Q3 2026 | Coding agents, data-operations automation and a roughly 10% technology-workforce reduction are new levers management now cites as the path back to margin expansion. |
| Medium-term margin framework deferred | dropped | Q4 2025, Q1 2026 | The 37-38% medium-term adjusted-margin target from the November 2023 Investor Day has gone unreaffirmed; new leadership called medium-term guidance premature and points to an upcoming Investor Day for a refreshed plan. |
Guidance ledger
Quotes, calls, and speakers are source-verified; outcomes are curator-classified.
| Verbatim guidance | Call | Speaker | Curator outcome | Outcome note |
|---|---|---|---|---|
| “we are guiding to incremental organic ASV growth of $90 million to $140 million, reflecting a 5% growth rate at the midpoint of our range” | FactSet Research Systems Inc., Q4 2024 Earnings Call, Sep 19, 2024 · 2024-09-19T15:00:00 | Helen Shan | kept | FY2025 closed with $127 million of organic ASV added, described as near the top end of the range on the Q4 2025 call. |
| “adjusted EPS is expected to be in the range of $16.80 to $17.40.” | FactSet Research Systems Inc., Q4 2024 Earnings Call, Sep 19, 2024 · 2024-09-19T15:00:00 | Helen Shan | kept | FY2025 adjusted EPS came in at $16.98, within the guided range per the Q4 2025 call. |
| “we're guiding to organic ASV growth of $100 million to $150 million, representing approximately 5% growth at the midpoint” | FactSet Research Systems Inc., Q4 2025 Earnings Call, Sep 18, 2025 · 2025-09-18T13:00:00 | Helen Shan | pending | Initial FY2026 ASV range; subsequently raised to $130-$160 million in Q2 2026 and Q3 ASV growth of 7.1% is running above the midpoint. Fiscal year not yet complete. |
| “Our adjusted EPS guidance range is from $16.90 to $17.60.” | FactSet Research Systems Inc., Q4 2025 Earnings Call, Sep 18, 2025 · 2025-09-18T13:00:00 | Helen Shan | pending | Initial FY2026 adjusted EPS range; later raised to $17.25-$17.75 in Q2 2026. Full-year outcome not yet reported. |
| “ASV growth is now expected at $130 million to $160 million, representing approximately 5.4% to 6.7% growth” | FactSet Research Systems Inc., Q2 2026 Earnings Call, Mar 31, 2026 · 2026-03-31T13:00:00 | Helen Shan | pending | Raised FY2026 ASV range after a strong first half; Q3 organic ASV growth of 7.1% is at or above the top of this range, but the year is not yet closed. |
| “We remain confident in the guidance ranges that were previously set for ASV, revenue, operating margin and EPS. On revenue and EPS in particular, we are tracking toward the high end of those ranges” | FactSet Research Systems Inc., Q3 2026 Earnings Call, Jul 01, 2026 · 2026-07-01T13:00:00 | Joshua Warren | pending | Q3 2026 reaffirmation of the raised FY2026 ranges; final Q4 results not yet reported. |
Q&A pressure map
Question counts and firms are curator tallies; analyst coverage shown above.
| Topic | Questions | Firms | Pressure / response |
|---|---|---|---|
| Margin trajectory and investment economics | 4 | UBS, Morgan Stanley, Wells Fargo, BofA Securities | The most-pressed cluster on the latest call: the ~300 bp year-over-year margin decline, one-time costs rolling into FY2027, investment payback periods and token-cost drag. Management pointed to a line of sight on improvement but gave few hard numbers, a recurring point of tension across recent quarters. |
| AI monetization | 3 | Deutsche Bank, Autonomous Research, William Blair | Analysts repeatedly probed how AI adoption translates into revenue beyond ASV optics; management leaned on adoption metrics and upsell rather than a discrete pricing mechanism. |
| ASV guidance conservatism | 1 | RBC Capital Markets | Opening question challenged why guidance implies a Q4 slowdown despite strong momentum; management cited a record year-ago comparison and its practice of not changing guidance intra-year. A theme analysts have raised in prior quarters as well. |
Language shifts
Only language evidence verified against the referenced component is shown.
| Observation | Verbatim evidence | Call ID | Component |
|---|---|---|---|
| Management's framing has shifted to positioning FactSet itself as core AI infrastructure, a more assertive claim than the 'trusted data' language of prior calls. | “As AI reshapes financial institutions, FactSet is becoming mission-critical AI infrastructure.” | 2003511099 | 2 |
| A new cost-and-efficiency vocabulary around AI-driven headcount reduction appears, absent from earlier calls that emphasized adding headcount. | “we initiated a roughly 10% reduction in our technology workforce” | 2003511099 | 2 |
| Token cost is introduced as an entirely new expense category, explicitly flagged as not previously modeled. | “Tokens are an interesting one in the sense that they were not a line item that we really thought about in 2025. So all of the token spending is net new.” | 2003511099 | 43 |
| The caution vocabulary of the prior-year guidance ('conservative,' 'longer sales cycles') has given way to acceleration language, marking a confidence shift versus the Q4 2025 setup. | “We are taking a conservative approach to our guidance to reflect the current environment of longer sales cycles and more rigorous client approval processes” | 1958502923 | 3 |
The call history shows a company mid-transition — new CEO and CFO, accelerating ASV and an aggressive AI pivot — with the debate now centered on whether AI-driven productivity converts the current margin compression back into expansion. Management's confidence has visibly risen, but the guidance is still reaffirmed rather than chased higher, and the deferred medium-term margin framework leaves the Investor Day as the next real test.
What FactSet is, and why the price has halved
FactSet sells financial data, analytics and workflow software to the investment industry on multi-year subscriptions, and it has grown revenue for 45 consecutive years and diluted EPS for 29. Yet the shares have fallen from $495.72 in November 2024 to $262.46, roughly halving, as organic growth slowed to mid-single digits and the market began pricing generative AI as a threat to the terminal-and-data model. This chapter orients a cold reader and fixes the question the report exists to answer.
Share price (16 Jul 2026)
From Nov-2024 peak
Market cap ($B)
FY2025 revenue ($M)
Annual Subscription Value ($M)
FY2025 diluted EPS
Sources: price, market cap and drawdown computed from daily market prices (all-time-high close $495.72 on 14 Nov 2024; $262.46 on 16 Jul 2026); revenue and EPS from the FY2025 Form 10-K [1] [2]; ASV from the FY2025 10-K [3].
The business, in plain terms
FactSet (Norwalk, Connecticut; founded 1978; fiscal year ends 31 August; NYSE: FDS) aggregates market, fundamental, and alternative data and delivers it through a workstation, feeds, and analytics that portfolio managers, sell-side bankers, wealth advisers, and corporate teams use to research, model, and monitor investments. Revenue is almost entirely recurring: clients contract for a defined set of data and users, and the sum of those annualized contracts is the company's headline operating metric, Annual Subscription Value (ASV), which stood at $2,405.6 million at the end of FY2025 [4].
The switching costs show up in the numbers a value investor cares about first. At FY2025 year-end FactSet served 8,996 clients and 237,324 users [5], retained more than 95% of ASV over the trailing year, and kept 91% of clients by count [6]. Its customer base is the industry's core: 95 of the top 100 global asset managers, 43 of the top 50 investment banks, and 37 of the top 40 wealth firms, with nine of its ten largest clients on the platform for more than 20 years [7].
That embeddedness is what has powered a rare compounding record: 45 consecutive years of revenue growth, 29 consecutive years of EPS growth, and 27 consecutive years of dividend increases [8]. Users have more than doubled since FY2018.
Source: user counts by fiscal year from FactSet segment KPI disclosures, consolidated into the FY2025 10-K figure of 237,324 [9].
The economics: high-margin, cash-generative, lightly levered
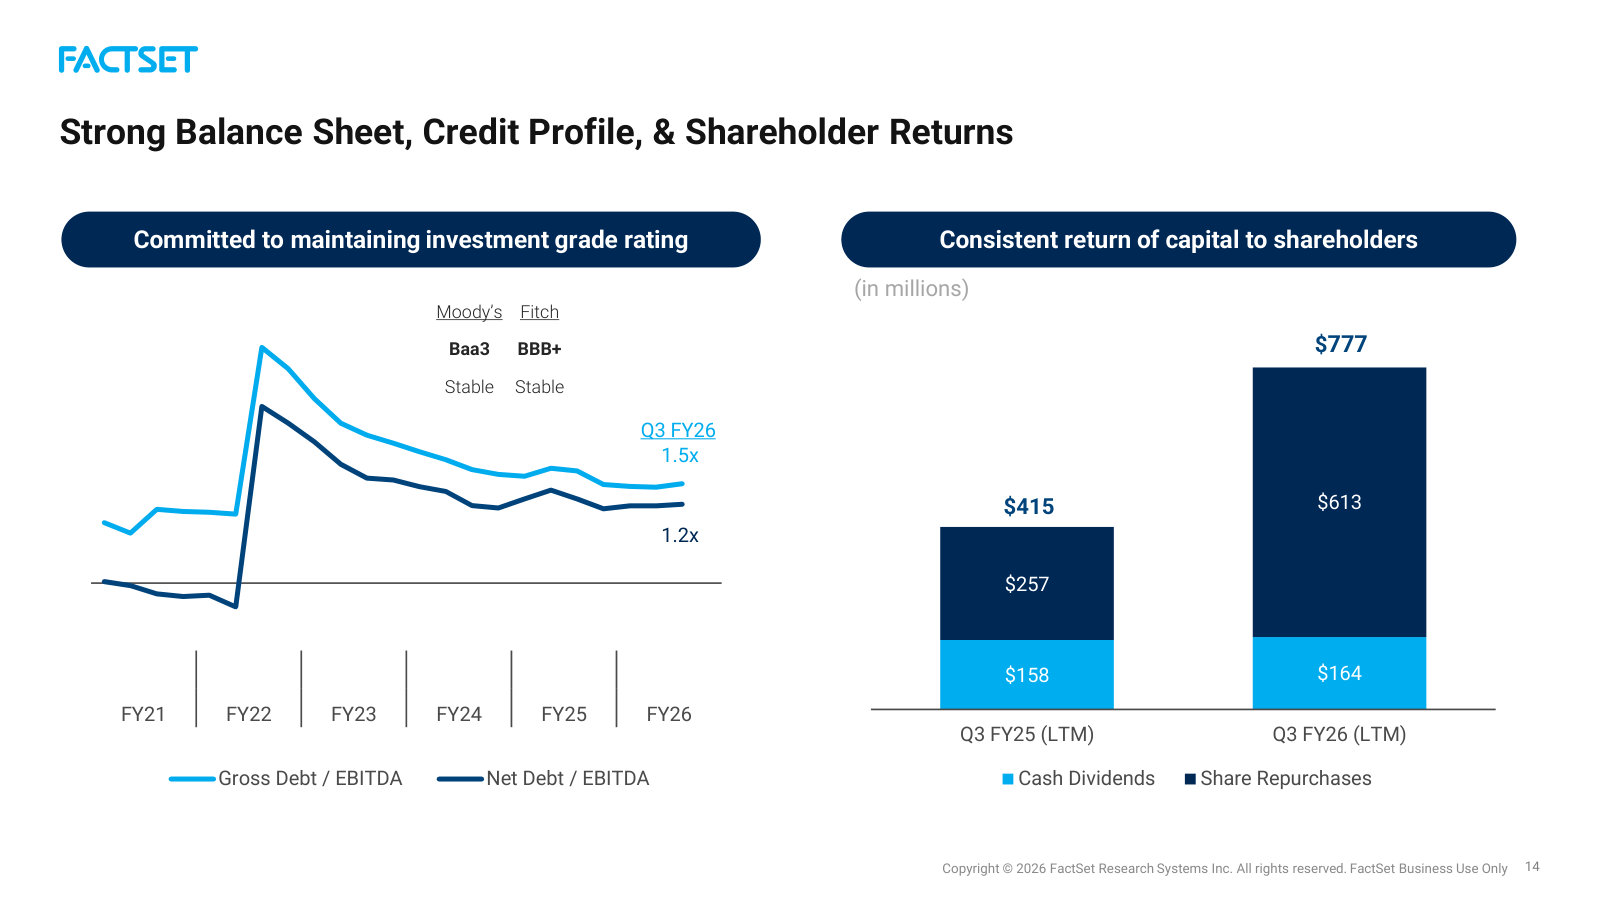
FactSet converts that recurring revenue into wide margins. FY2025 revenue was $2,321.7 million and operating income $748.3 million — a 32.2% operating margin, up from 25.8% in FY2022 [10] [11]. Diluted EPS rose 11.8% to $15.55, and the company returned $460.4 million to shareholders through buybacks and dividends during the year [12].
Source: consolidated statements of income, FactSet FY2023 10-K (FY2021–FY2023) [13] and FY2025 10-K (FY2024–FY2025) [14].
The balance sheet is conservative for a business that carries acquisition debt: about $1.37 billion of total debt against roughly $0.34 billion of cash and $726 million of operating cash flow in FY2025. Interest is covered many times over, and net leverage sits near one-and-a-half times cash earnings. For a reader who wants the probability of bankruptcy near zero, FactSet clears that bar comfortably — the debt was taken on to buy the CUSIP Global Services franchise, not to plug an operating hole, and it is amortizing.
Why the market marked it down
Two things changed at once. First, growth decelerated. Reported revenue growth fell from 15.9% in FY2022 to 5.4% in FY2025, and — stripping out the CUSIP acquisition that flattered FY2022–FY2023 — organic ASV growth was 4.8% in FY2024 and 5.7% in FY2025 [15] [16]. A franchise the market had valued as a mid-teens compounder was resetting to mid-single digits.
Source: year-over-year growth computed from consolidated revenue in the FY2023 and FY2025 10-Ks [17] [18].
Second, the story got harder to underwrite. Generative AI cuts both ways for a data vendor — it can lower the cost of assembling data and answering research questions, which threatens the premium a workstation commands, even as FactSet embeds the same tools in its own products. And in June 2025 the board replaced Phil Snow, a 30-year insider and CEO of a decade, with Sanoke Viswanathan, a 15-year JPMorgan executive and the first outsider to run the company in its modern history [19]. A first-time outside CEO arriving as growth slows is a governance change a buyer has to price.
The result is a sharp de-rating. At its November 2024 peak the stock traded near 35.6 times trailing earnings; at $262.46 it trades at 16.9 times FY2025 EPS and about 14.7 times the $17.81 the analyst consensus expects for FY2026 — a market multiple for a business that spent years commanding a large premium.
Source: calendar year-end closing prices from daily market data; the intraday-basis all-time-high close was $495.72 on 14 November 2024.
The through-line this report follows
FactSet is a fallen star: a best-in-class financial-data franchise, with 95%-plus ASV retention and a 45-year growth record, whose shares have roughly halved from their late-2024 peak as organic growth settled into the mid-single digits and the market began pricing generative AI as a structural threat to the data-and-terminal model. The question this report exists to answer is whether the de-rating has handed a value investor a genuine margin of safety — in a business whose bankruptcy risk is near zero — or whether roughly 15 times forward earnings still overpays for a franchise that no longer compounds the way its record implies.
Two facts frame that question honestly. In FactSet's favor: the moat is visible in the retention and client-tenure data, the cash conversion is high, and the balance sheet removes the tail risk this reader most fears. Against it: the company is not founder-run. FactSet's first outside CEO (Sanoke Viswanathan, ex-JPMorgan) took over owning zero shares at a firm whose directors and officers hold just 1.2% in total (~0.2% outright) and where no insider bought the halving of the stock, so alignment is now engineered through a ~$71M pay package, not owned. The "skin in the game" this reader prizes is thin, and the AI question is genuinely unresolved. What would settle it is evidence over the next several quarters on whether organic ASV growth stabilizes or keeps sliding, and whether AI shows up as a tailwind in FactSet's own pricing or as a discount in its clients' willingness to pay. The chapters that follow test each leg in turn.
FactSet's five-year record reads like a quality compounder: revenue up from $1.59 billion (FY2021) to $2.32 billion (FY2025), a near-27% free-cash-flow margin, and $460 million returned to owners in FY2025 alone. But the FY2025 headline flatters the trend. Reported diluted EPS rose 11.8%; on an adjusted basis, stripping a one-time divestiture gain and an easy prior-year comparison, it grew 3.2%. The cash generation is real and durable; the "double-digit growth" is not.
Five years of revenue and margin
Revenue compounded at roughly 9.8% a year from FY2021 to FY2025, but the shape of that growth changed. The FY2022–FY2023 mid-teens jump was lifted by the March 2022 acquisition of CUSIP Global Services (CGS); reported growth then settled to 5.6% in FY2024 and 5.4% in FY2025 as that acquisition annualized and organic demand did the work [1].
Source: FY2025 Annual Report (Form 10-K), Consolidated Statements of Operations [2]; earlier years from FY2022 Annual Report (Form 10-K) [3].
Reported operating margin tells a story that needs a footnote. It rose from 25.8% in FY2022 to 32.2% in FY2025 — a 640-basis-point expansion the bull case leans on. But FY2022 was a depressed base: FactSet took a $64.3 million asset-impairment charge that year (of which $62.2 million came from vacating leased office space as it resized its real-estate footprint for hybrid work), which alone cut roughly 350 basis points off the margin [4]. Measured from FY2021's 29.8%, the expansion to 32.2% is closer to 240 basis points over four years.
Source: derived from reported financials, FY2021–FY2025 10-Ks; FY2022 impairment detail per FY2022 Annual Report (Form 10-K) [5].
What the FY2025 headline leaves out
The record is most useful for the calibration it forces. FactSet's own non-GAAP reconciliation makes the point without editorializing: reported operating income grew 6.7% in FY2025, but adjusted operating income grew 1.3%, and adjusted operating margin actually fell, from 37.8% to 36.3% [6].
Reported diluted EPS rose 11.8% in FY2025. Adjusted diluted EPS rose 3.2%. The difference is a $0.45-per-share gain on a business divestiture in the current year and a weak prior-year base that carried a $1.03-per-share sales-tax charge.
The mechanics sit on the income statement. FY2025 pretax income grew faster than operating income because "other income (expense), net" swung from negative $49.8 million to negative $27.3 million — a $22.5 million improvement driven largely by a $22.4 million other-income line that houses the divestiture gain, plus lower interest expense as debt was paid down [7]. Management states plainly that the rise in net income and EPS was "primarily driven by higher operating income and a gain from the divestiture of a business" [8].
Source: FY2025 Annual Report (Form 10-K), non-GAAP reconciliation of operating income, net income and diluted EPS [9].
None of this is aggressive accounting — the adjustments are disclosed and the items are genuinely one-time, cutting both ways across years. The point is calibration: a reader who anchors on "EPS up 11.8%" will overstate how fast this franchise actually compounds. The underlying rate in FY2025 was low single digits.
Not every part of that gap is one-time, though. The $1.932 billion CGS purchase both reset FactSet's return on capital from the mid-20s to about 20% and left a recurring ~$53M-a-year amortization add-back that permanently flatters adjusted EPS above GAAP, so the return-on-capital decline and the earnings-quality gap share one cause; the mechanics run through Capital Allocation.
Cash conversion is the durable part
Where the record holds up unambiguously is cash. Operating cash flow rose every year from FY2021 to FY2025, reaching $726 million, and free cash flow (after a rising capital-expenditure line) reached $617 million — a 26.6% free-cash-flow margin and roughly 1.0x conversion of net income [10]. The divestiture gain does not flatter this figure: the non-cash gain is removed in the cash-flow statement, and only the $25 million of cash proceeds sits in investing activities [11].
Source: FY2025 Annual Report (Form 10-K), Free Cash Flow table and Consolidated Statements of Cash Flows [12].
One watch item lives inside that cash line. Capital expenditure — property, equipment and capitalized internal-use software — climbed from $60.8 million in FY2023 to $85.7 million in FY2024 and $108.8 million in FY2025, which is why free cash flow was essentially flat year-over-year (up $2.8 million) despite $26 million more operating cash [13]. The rising spend tracks the company's AI-platform build; it either converts to faster ASV growth or simply resets the capex baseline to a higher level.
Capital returned, and a balance sheet with room
FactSet returned $460 million to shareholders in FY2025 — $160 million in dividends (a 27th consecutive year of increases) and $300 million in buybacks — against $617 million of free cash flow, a 75% payout that leaves headroom [14]. Notably, repurchases stepped up as the shares fell — $177 million (FY2023), $235 million (FY2024), $300 million (FY2025) — the pattern a value investor wants to see from management buying its own equity into a de-rating.
Source: FY2025 Annual Report (Form 10-K), Consolidated Statements of Cash Flows — financing activities [15].
The buybacks come with an asterisk. Diluted share count went from 38.6 million (FY2021) to 38.4 million (FY2025) — down only about 0.5% — despite roughly $1.0 billion of cumulative repurchases, because stock-based compensation and employee-plan issuance offset most of the retirement [16]. The repurchase program has largely defended the share count rather than shrunk it.
The balance sheet is the reader's insurance against the calibration mistake noted earlier. FactSet has deleveraged from the CGS-financed peak: net debt fell to about $1.03 billion and debt-to-equity to 0.63x (from 1.49x in FY2022), against $935 million of FY2025 EBITDA — roughly 1.1x net leverage [17]. During FY2025 the company refinanced, raising $803 million of new debt to repay $805 million of old [18]. Bankruptcy risk is not a live question here, which matters for a reader who has been burned by it before.
Where the growth actually comes from — and a recent inflection
Revenue is concentrated in the Americas, which produced 65% of FY2025 revenue; EMEA added 25% and Asia Pacific 10% [19]. Segment operating income by region is not a clean read of geographic profitability — FactSet centralizes most content and technology cost in the Americas, so the region carries the cost load while EMEA and Asia Pacific look far more profitable than they independently are — so the useful geographic signal is revenue, not segment margin.
Source: FY2025 Annual Report (Form 10-K), MD&A segment results by geography [20].
The forward-looking metric FactSet manages to is Annual Subscription Value — contracted forward revenue for the next twelve months. Organic ASV growth is where the recent record turns from a deceleration story into an inflection. It bottomed at 4.8% for FY2024 [21], recovered to 5.7% for FY2025 [22], and has climbed through FY2026 to 6.7% at February 2026 [23] and 7.1% at May 2026 [24]. The slowdown that framed the de-rating (De-Rated Compounder) is, on the most recent data, reversing.
Source: quarterly organic ASV growth as reported; anchor points per FY2025 10-K [25], Q2 FY2026 10-Q [26] and Q3 FY2026 10-Q [27].
What the forward estimates say
Consensus does not extrapolate the ASV re-acceleration into the earnings line. Sixteen-to-eighteen analysts model FY2026 revenue of about $2.47 billion (up 6.4%) and FY2027 of $2.61 billion (up 5.8%) — mid-single-digit top-line growth holding. On the bottom line, consensus adjusted EPS of $17.81 for FY2026 is only 4.9% above FY2025's adjusted $16.98 — consistent with the low-single-digit underlying rate this chapter identified, not the 11.8% GAAP headline.
Source: consensus analyst estimates (16–18 analysts), as of July 2026.
The sell side is unusually cautious for a franchise of this quality, which fits the "fallen star" frame. Of the most recent ratings, none were strong buys — two buys, ten holds, four sells and two strong sells — and the mean price target of $254 sits below the $262 spot price, with a $210-to-$340 range around it.
Price (16 Jul 2026)
Mean Target
Low Target
High Target
Source: consensus analyst price targets and recommendation distribution, as of July 2026.
The financial record, then, cuts two ways for the report's central question. The business is a genuine cash machine with a fortress balance sheet, disciplined-if-dilution-offsetting buybacks, and — most recently — re-accelerating subscription growth. Against that, its underlying earnings power grew low single digits in FY2025 once the divestiture gain and prior-year noise are removed, and the Street already prices modest growth with a mean target below the market. Whether that combination is a margin of safety or a fair price for a slower compounder is what the valuation work has to resolve.
FactSet's advantage shows up first in subscription retention. Annual ASV retention has held above 95% every year from FY2020 through FY2025, with client retention in a 90–92% band through a rate shock and a growth slowdown [1]. That durability, plus pricing power and deep workflow embedding, is a real moat — but a narrow one built on switching costs, not scale. Generative AI, the risk the de-rating priced, now reads on the evidence as more tailwind-at-the-margin than existential threat, with early but small monetization.
The moat is retention, not size
FactSet ended FY2025 with 8,996 clients and 237,324 users, retaining more than 95% of annual subscription value and roughly 91% of clients [2].
ASV Retention (min)
Client Retention
Clients
Users
Source: FactSet FY2025 Annual Report (Form 10-K), Item 1 Business — ASV retention stated as "greater than 95%" [3].
What makes the number a moat rather than a snapshot is that it barely moves. Across six fiscal years spanning the 2022 rate shock, the banking hiring slump, and the organic-growth trough covered in the Financial Record, client retention stayed within two percentage points of 91%, and ASV retention never fell below 95%.
Source: FactSet FY2021–FY2025 Annual Reports (Form 10-K), MD&A; ASV retention stated as "greater than 95%" in each year [4].
The mechanism behind the stickiness is embedding, not novelty. Management describes FactSet as running performance, attribution, and risk analytics for over 6 million institutional portfolios every night, and integrating more than 15 million wealth portfolios, used across clients' front, middle, and back offices [5]. Ripping that out means re-plumbing nightly production workflows, which is why the annual price increase has been a recurring driver of organic ASV in every 10-K — in FY2025, sales to existing clients and price increases lifted organic ASV 5.7% to $2,370.9 million [6]. By Q2 FY2026 management reported the annual Americas price increase contributed more than the prior year, attributing it to value, retention, and enterprise-agreement escalators [7].
The moat defends share; it does not confer scale
FactSet names its largest competitors as Bloomberg L.P., S&P's Market Intelligence division, and LSEG's Data and Analytics division (formerly Refinitiv), with BlackRock Aladdin, MSCI, and Morningstar as further competitive products [8]. Against that field, FactSet is small. Its $2.32 billion of FY2025 revenue is below Morningstar and MSCI, and a fraction of the diversified majors.
Sources: FactSet FY2025 10-K, competitor naming [9]; peer revenue per reported FY2025 annual results. Bloomberg is privately held and larger; LSEG's Data and Analytics division is also larger and is excluded from the bar because the indexed LSEG filing is a sub-entity.
Two cautions temper the chart. S&P Global and Moody's earn much of their revenue from credit ratings, not data workstations, so they are not clean comparables; the honest reading is that FactSet competes for the same data-and-analytics budgets as balance sheets several times its size, including Bloomberg's terminal franchise and LSEG's Refinitiv base. That gap is the strategic constraint behind the through-line: the moat has proven strong enough to defend share — retention above 95% — but not to out-grow a mid-single-digit market, which is why organic ASV growth sat in the 5–7% range even as retention held. Execution and breadth, not size, are what FactSet sells.
Generative AI: the threat the de-rating priced
The bear case is not speculative; it is written into the filings. FactSet first added a dedicated artificial-intelligence risk factor in its FY2023 10-K, warning that introducing generative AI could bring new liabilities [10]. By FY2025 the language had sharpened to name agentic AI and to concede directly that "third parties may be able to use AI to create technology that could reduce demand for our products and services," alongside a competition risk factor noting that many rivals "have significant AI capabilities and funding" [11].
Peer MSCI states the mechanism more bluntly than FactSet does: AI-enabled tools "may allow clients… to develop in-house capabilities to replace our products," and "large-scale data scraping and generative AI models trained on publicly available information could also diminish the perceived uniqueness and commercial value of our proprietary content" [12]. That is the disintermediation fear the market applied to FactSet when the multiple compressed. And FactSet's own early record fed the doubt: when it launched its GenAI assistant, FactSet Mercury, management said monetization "remains under discussion" and was "not included in this year's guidance" [13].
Generative AI: the tailwind now in the numbers
Two years on, monetization has moved from theory toward evidence, though the dollar base is still small. FactSet guided GenAI products to add only 30–50 basis points of ASV in FY2025, and its new CEO cautioned that firms "often underestimated the complexity involved in realizing" AI's value [14]. By Q3 FY2026 the tone had turned concrete: management said over 10% of the quarter's ASV growth came directly from AI SKUs, more than 20% of its top-100 clients were using its Model Context Protocol (MCP) data connectors on a paid basis, and one top-ten client "literally doubled their data subscriptions with us because of AI," and, on the moat, said the connected data and embedded workflows are "starting to see evidence rather than theory" [15]. Management added that MCP-linked deals improved contract value roughly 90% of the time [16].
The magnitude deserves plain framing. "Over 10% of ASV growth" is 10% of an annual growth increment of roughly $165 million on a $2.5 billion base — on the order of $16–17 million of incremental ASV, and management-sourced rather than an audited line item. It is early, not decisive. What makes it more than noise is that it aligns with independently visible trends: AI-ready data was cited as a demand driver in the Americas and Asia Pacific in Q1 FY2026, when wealth grew organic ASV 10% and off-platform data feeds and APIs became a rising share of expansion [17]. Management's competitive answer to the "point-solution" AI startups is integration — clients wanting one workflow instead of many tools — and it is applying AI internally as a margin lever, having captured more than half of a targeted 100 basis points of productivity gains this year [18]. AI is also one of the three core strategic pillars FactSet funds, alongside data and workflow depth [19].
Weighing the two readings
The same facts support both a tailwind and a threat interpretation; what separates them is which effect dominates over time.
Sources: FactSet FY2025 10-K risk factors [20]; MSCI FY2025 10-K [21]; Q3 FY2026 [22] and Q2 FY2026 [23] earnings calls.
The evidence points to a narrow-but-real moat and to AI as, so far, a net tailwind at the margin. Retention above 95% held through a full cycle, pricing power is intact, and AI monetization has begun to show up in ASV rather than only in slideware. The strongest fact against that read is the one MSCI names and FactSet concedes in its own risk factor: if frontier models and scraped public data erode the willingness to pay for aggregated proprietary content, a mid-sized specialist competing against far larger balance sheets is more exposed than the scale leaders. What would change the read in either direction is checkable in the filings: user and seat counts turning down (willingness-to-pay erosion), price realization reversing, or AI-SKU ASV stalling would confirm the threat; a broken-out AI revenue line growing to a material share of ASV, with retention holding above 95%, would confirm the tailwind.
FactSet's first outside CEO (Sanoke Viswanathan, ex-JPMorgan) took over owning zero shares at a firm whose directors and officers hold just 1.2% in total (~0.2% outright) and where no insider bought the halving of the stock, so alignment is now engineered through a ~$71M pay package, not owned. [1] FactSet does not clear the founder-ownership test a skin-in-the-game investor runs: the two founders left the register long ago, and the register is now led by index and active institutions rather than a founding family.
Insiders own almost none of it
Beneficial ownership rules flatter the picture. As of 1 October 2025, all 21 directors and executive officers as a group beneficially owned 439,643 shares, or 1.2% of the 37.5 million shares outstanding — but that figure includes 356,070 shares issuable on option exercise and 6,775 on unit vesting within 60 days [2]. Strip the options and units and the group holds roughly 76,800 shares outright — about 0.2% of the company.
Insiders (group)
Held outright (est.)
New CEO shares
Baron (BAMCO)
Sources: 2025 Proxy Statement, Security Ownership tables [3][4]; "held outright" derived from the proxy's option/unit footnotes; Baron holding per its SEC Schedule 13G/A dated 6 March 2026.
The individual holdings tell the same story. F. Philip Snow, the outgoing CEO after 30 years at the firm, beneficially owned 180,703 shares — of which 160,951 were unexercised options and 3,058 unvested units, leaving under 17,000 shares held outright, roughly $4 million at the current quote [5]. New CEO Sanoke Viswanathan, who joined on 8 September 2025, owned zero shares at the record date [6]. Two directors held none, and the rest held four- and five-figure positions [7].
Source: 2025 Proxy Statement, Security Ownership — Directors and NEOs (as of 1 Oct 2025); figures include options/units vesting within 60 days [8].
The founders are gone entirely. Howard Wille and Charles Snyder, who started FactSet in 1978, no longer appear among either the company's 5% holders or its insiders — the register is now led by index and active institutions, not a founding family [9]. For an investor whose preference runs to owner-operators, FactSet does not clear that bar; the question this chapter works through is whether the pay design and the shareholder base compensate for it.
The tape: insiders sold, an outside fund bought
The clearest read on conviction is what people do with their own money in the open market. Through the roughly 47% drawdown, FactSet insiders did almost no buying. Since the start of 2023, directors and officers made just four open-market purchases totaling about 1,200 shares, against 47 open-market sales of roughly 82,900 shares for about $37 million in proceeds — a pattern of routine option-exercise-and-sell, not accumulation into weakness.
Source: SEC Form 4 filings, aggregated (transactions coded P and S), January 2023 – May 2026; as compiled from company filings.
The offsetting signal came from outside the building. BAMCO — the Baron Capital vehicle behind the Baron growth funds, a manager known for concentrated, long-horizon positions — accumulated aggressively as the stock fell. Its most recent Schedule 13G/A, dated 6 March 2026, reports a 9.35% stake, up from the 6.6% the proxy recorded from Baron's late-2024 filing [10]. Alongside the index-driven blocks held by Vanguard (12.2%) and BlackRock (9.3%), Baron is now the largest discretionary holder, and the only sizable position built by an active manager buying into the decline rather than tracking an index [11].
Sources: 2025 Proxy Statement, Beneficial Owners table (Vanguard, BlackRock, Morgan Stanley, State Street; Baron shown at proxy date 6.6%) [12]; Baron holding updated to 9.35% per its Schedule 13G/A dated 6 March 2026.
Pay: cash-modest, equity-heavy, and a 536:1 ratio
FactSet pays its senior team mostly in stock, which is where the alignment actually sits. Snow's fiscal-2025 total compensation was $9.46 million: a $775,000 salary, $3.75 million in stock awards, $3.75 million in options, and $1.17 million in cash incentive [13]. Equity was about 79% of the package — so while insiders own little outright, their year-to-year rewards move with the share price. The other named officers were paid $2.2 million to $4.5 million on the same structure [14].
Source: 2025 Proxy Statement, Summary Compensation Table (salary + non-equity incentive as cash; stock + option awards as equity) [15].
The optics carry one number worth flagging. FactSet discloses a CEO-to-median-employee pay ratio of 536 to 1, on a median employee total compensation of $17,636 [16]. That median is low because a large share of FactSet's headcount sits in content-operations and technology centers in lower-cost countries; it is a workforce-mix artifact more than an outlier in US executive pay, but it is a headline a governance-sensitive holder will meet.
The new CEO's package: large, front-loaded, partly at-risk
Hiring an outsider who owns nothing meant buying alignment up front. Viswanathan's employment agreement sets a $1.0 million base salary, a target cash bonus of 200% of base, and — beginning in FY2028 — an annual equity award targeted at $11 million [17]. On top of that came a one-time hiring bundle: $3 million in cash to replace forfeited 2025 incentive, a further $10 million in cash repayable if he leaves before 9 September 2026, $26 million in time-vesting restricted units over four years, and $10 million in three-year performance units [18].
Source: 2025 Proxy Statement, CEO New Hire Compensation Package [19][20].
The one-time bundle totals about $71 million in grant-date value, which reads as a lot for a company the market had just cut in half. The structure is more defensible than the headline. The single largest performance piece is a $22 million grant of stock options that vest only if FactSet's shares reach 150% of the grant-date price — roughly a 50% gain — measured on a trailing average, cannot be exercised before the third anniversary, and run over a five-year window [21]. That grant pays nothing unless the de-rating this report examines reverses substantially. The counterweight is the $26 million of make-whole restricted units, which vest on time served rather than performance — retention pay that arrives whether or not the stock recovers.
Alignment is also mandated going forward. FactSet's stock ownership guidelines require the CEO to hold shares worth six times base salary, the CFO three times, and other executives twice — with a five-year window to comply and a rule to retain half of all net after-tax shares from vesting until the target is met [22]. So the near-zero insider stake is partly a timing artifact of a fresh outside hire; the framework is designed to build a stake over the coming years, not to leave one absent.
Governance is clean, if unexciting
On the housekeeping that a burned investor checks, FactSet is orderly. Its guidelines require the Chair and CEO roles to be separate [23], and every director other than the CEO is independent, with fully independent audit, compensation, and nominating committees [24]. The company reports no material related-party transactions in fiscal 2025 [25], and the pay program has drawn consistent shareholder support — 94.6% approval on the most recent say-on-pay vote [26]. There is no controlling block, no dual-class structure, and no related-party leakage of the kind that turns a cheap stock into a value trap. What there also is not is an owner at the table whose net worth rides on the outcome.
A calibrated read
For a value investor who prizes founder ownership and skin in the game, FactSet reads as a near-miss on that specific taste and a pass on the governance-risk checklist. The founders are gone, insiders own about 1.2% and hold far less outright, the incoming CEO owned nothing at the record date, and through a halving of the share price not one insider stepped up with a meaningful open-market purchase. The offsets are real but indirect: pay is roughly 80% equity so incentives track the stock, ownership guidelines will force a stake to accumulate, the marquee CEO grant only pays on a 50%-plus recovery, and Baron — a discretionary manager with a long horizon — nearly doubled its position to 9.35% into the weakness.
The honest way to hold this is that alignment at FactSet is contractual and prospective, not proprietor-deep. What would move the read toward the reader's preference is concrete: sustained open-market buying by directors and the new CEO, or Viswanathan building a holding well beyond the mandated six-times-salary floor. What would move it the other way is the retention half of the package vesting on time alone while the performance options expire worthless — pay for staying, in a stock that never re-rated.
What the price pays for growth
At $262.46, FactSet trades at roughly 14.7x forward earnings and 16x free cash flow — about half the 30–42x multiple it carried from FY2019 through FY2024. Discounted back at a 9% cost of equity, that price implies the market expects only about 2.7–3.6% annual free-cash-flow growth in perpetuity — a range, not a single point, once the roughly $1.0bn net-debt bridge is carried — against a business whose organic subscription growth has re-accelerated to 7.1%. The de-rating has opened a real asymmetry between price and quality. It has not made the stock statistically cheap, and the sell-side mean target sits fractionally below spot.
The de-rating, quantified
FactSet spent most of the last decade priced as a premium compounder. At each fiscal year-end from FY2019 to FY2023 the stock changed hands at 30–42x trailing earnings; the peak close of $495.72 on 14 November 2024 valued it near 36x. By the FY2025 year-end that had fallen to 24x, and at $262.46 the trailing multiple is 16.9x — 14.7x on the FY2026 consensus of $17.81. The price roughly halved while earnings kept rising: FY2025 revenue grew 5.4% to $2.32bn, operating income 6.7% to $748.3m, and diluted EPS 11.8% to $15.55 [1].
Source: derived from reported diluted EPS (FY2025 Form 10-K [2]) and NYSE closing prices; "Now" is the $262.46 close of 16 Jul 2026 on trailing FY2025 EPS.
The cash the business throws off frames the same shift. FactSet generated $617.5m of free cash flow in FY2025 — operating cash flow of $726.3m less $108.8m of capital expenditure and capitalised software [3]. Against a $10.1bn market capitalisation that is a 6.1% free-cash-flow yield; the FY2026 earnings yield is 6.8%. Both sit at the high end of anything the stock has offered a buyer in years.
Forward P/E (x)
FCF yield
Earnings yield (FY26E)
Shareholder yield
Sources: FY2025 free cash flow and the $460.4m returned to shareholders, FY2025 Form 10-K [4] [5]; FY2026 consensus EPS $17.81; yields on the $262.46 close and ~$10.1bn market cap.
What the price implies
The cleanest way to read a de-rated compounder is to reverse the arithmetic: hold the discount rate fixed and solve for the growth the price is paying for. A two-stage discounted-cash-flow — FY2025 free cash flow of $617.5m [6], a 9% cost of equity, a 3% terminal rate, and net debt of about $1.0bn — returns a fair value equal to today's price when free cash flow compounds at roughly 2.7–3.6% a year for the next decade — a range rather than a single point, because the answer moves with how the ~$1.0bn net-debt bridge and terminal assumptions are set. Even the top of that corrected bar sits well below the 7.1% organic subscription growth of the May-2026 quarter — itself a seasonal high that runs ahead of the roughly 5.4–6.7% pace management guides for full-year FY2026. Push the assumed growth up in one-point steps and the fair value climbs quickly.
Source: two-stage DCF derived from FY2025 free cash flow [7]; 9% cost of equity, 3% terminal growth, ~$1.0bn net debt, 38.4m shares. The price-implied breakeven growth is assumption-dependent — roughly 2.7–3.6%, not a single point — once the net-debt bridge is carried.
The gap between what the price pays for — roughly 2.7–3.6% — and what the business is currently delivering is the margin of safety. Organic annual subscription value grew 5.7% in FY2025 to $2,370.9m [8], and by the May-2026 quarter had accelerated to 7.1%, more than 250 basis points above the year-earlier rate [9] — a fifth consecutive quarter of acceleration [10]. If free cash flow simply tracks a mid-single-digit ASV path, the DCF points to $300–350 a share, 15–30% above spot. Getting there does not require the AI optimism the bulls invoke; it requires the franchise to keep doing roughly what it already does.
The scenarios that bound it
Three cases frame the range, each tied to how organic growth and margins evolve rather than to sentiment.
The bear case is a structural fade: organic ASV slips back toward 3% as AI-native tools chip at seat demand and pricing, and the margin investment underway does not pay back. Free cash flow grows 0–3%, and the DCF fair value falls to roughly $220–276 — spot to about 16% downside. The base case is the franchise holding its current cadence: organic ASV in the 5–6% band, free cash flow compounding with it, and fair value near $300–350. The bull case is durable AI monetisation lifting organic growth through 7% while the productivity programme restores margin; free cash flow growth of 6–7% supports $350 and above, and the multiple begins to re-rate off a decade-low base.
The distribution is asymmetric but not lopsided. The downside is real — a genuine break in the subscription model, not merely a slow year — yet even the bear DCF lands within about 16% of spot because the cash generation is so durable. The upside opens once growth is simply sustained, which is why the recent acceleration matters more than any single quarter's headline.
The counter-case, and what would settle it
The strongest fact against a value read is the sell-side's own arithmetic. The mean analyst price target is $254 and the median $246.50 — both below the $262 spot — and the rating distribution runs to ten holds, four sells and two strong sells against only two buys. On the desks that model this name quarter by quarter, 14.7x forward is close to fair, not cheap.
The second is margin. Adjusted operating margin fell to about 34% in the May-2026 quarter, down roughly 300 basis points year over year, as FactSet spent on marketing, performance compensation tied to ASV momentum, and AI-driven productivity work [11]. Adjusted EPS grew 6.1% that quarter — below the 7.1% ASV growth [12]. The re-acceleration is being bought with reinvestment, so near-term free-cash-flow growth may undershoot the smooth path a DCF assumes even if ASV holds.
The third is the absolute level. At 14.7x forward FactSet is below its own history and the broad market, but it is not a low-multiple stock in the sense a deep-value buyer means it — a mid-single-digit grower at ~15x is priced for a fair, not a generous, return. The safety on offer here rests on quality and durability: ASV retention above 95%, free cash flow that has risen every year, and a balance sheet that makes the bankruptcy the reader most fears a remote outcome. It does not rest on buying assets for a fraction of their worth.
What would move the read is observable and near. Organic ASV sustaining 7% or better for another two or three quarters, with the margin trough behind it, would validate the base-to-bull path and leave 14.7x looking like an anomaly the market corrects. Organic ASV slipping back below 5% while margins stay compressed would confirm the ~2–3% growth the price already assumes — and turn a de-rated compounder into a fairly valued one. The capital being returned while that resolves — $460.4m in FY2025, and a fresh $400m repurchase authorisation running to September 2026 [13] — pays the buyer to wait, and the accelerated Q3 buyback of about 926,000 shares for $203m shows management leaning into the lower price rather than away from it [14].
The $1.932 billion CGS purchase both reset FactSet's return on capital from the mid-20s to about 20% and left a recurring ~$53M-a-year amortization add-back that permanently flatters adjusted EPS above GAAP, so the return-on-capital decline and the earnings-quality gap share one cause. [1] [2] [3]
Between FY2021 and FY2025 FactSet deployed roughly $4.1 billion of capital, and nearly six dollars in ten went to acquisitions rather than to shareholders. The defining act was that March 2022 purchase of CUSIP Global Services — a debt-funded bet that nearly doubled the balance sheet, loaded three-quarters of it into goodwill and intangibles, and roughly halved return on capital employed, from about 25% before the deal to a 13% trough and a ~20% recovery since. The franchise it bought is a genuine monopoly.
Where the money went
Source: acquisition purchase prices from FY2022 10-K Note 6 [4] and Q2 FY2025 10-Q Note 6 [5]; buybacks and dividends from the FY2025 cash-flow statement [6].
The shape of the bars tells the story. For most of its history FactSet was a straightforward cash-return compounder: recurring subscription cash funded a rising dividend and a steady buyback. In FY2022 that pattern broke. To fund CGS, management paused repurchases — buybacks collapsed from $264.7 million in FY2021 to $18.6 million [7] — and drew down debt. Across the five years, acquisitions absorbed about $2.39 billion, buybacks about $1.0 billion, and dividends about $0.69 billion. CGS alone was 47% of everything deployed.
The dividend is the one leg that never wavered. It rose every year of the period, from $117.9 million to $160.0 million [8], about 7.9% a year, extending a multi-decade record of consecutive increases. The buyback did more work but bought less than its size suggests, a point the share count makes plainly below.
The CGS bet, decomposed
CGS is not a conventional business purchase. Of the $1.932 billion price, only $215.0 million landed in goodwill; $1.583 billion was assigned to a single intangible — the "ABA business process," a renewable license from the American Bankers Association to operate the CUSIP numbering system — with a further $164.0 million of client relationships and $46.0 million of databases [9]. Essentially the entire price bought one exclusive franchise: CGS is the sole issuer of CUSIP and CINS identifiers and the U.S. numbering agent for ISINs [10]. That is the quality case: a licensed monopoly embedded in the plumbing of the securities market, with pricing power FactSet has cited as an organic-ASV driver in every year since.
Two costs come attached. First, amortization: the acquired intangibles carry useful lives of 15 to 36 years, which works out to roughly $53 million a year of straight-line amortization on the CGS assets alone [11]. That charge depressed the FY2022 operating margin and is a standing item FactSet adds back to reach adjusted earnings [12] — part of why the GAAP-versus-adjusted gap runs the way the Financial Record describes. Second, a legal overhang: FactSet is a defendant in a purported antitrust class action over its acquisition and operation of CGS (Dinosaur Financial Group LLC et al. v. S&P Global, Inc. et al.) [13]. Management does not expect a material adverse outcome, but the suit challenges the very licensing economics that justify the price.
A precise return on the deal itself cannot be computed from the filings: FactSet does not disclose CGS revenue and calls its effect "not material" for pro-forma purposes. The one quantified marker is the auditor's control carve-out, which put CGS at 5% of consolidated revenue in FY2022 [14] — and that covered only six months of ownership. What is computable is the effect on the whole company, and it is unambiguous.
What it did to returns and the balance sheet
Source: derived from reported operating income and capital employed, FY2019–FY2025 10-Ks; operating income per the FY2025 income statement [15].
Return on capital employed averaged about 27% in the three years before CGS and fell to 13.3% in FY2022, the year the purchase price landed on the balance sheet [16]. It has climbed back to 19.8% by FY2025 as the acquired earnings season, but it has recovered only about two-thirds of the way to where it started. At ~20%, capital efficiency still sits comfortably above a ~9% cost of equity — the deal creates value at the margin — though it runs below the mid-20s FactSet earned before CGS.
The balance sheet shows why. The transaction converted FactSet from a light-capital business into an intangibles-heavy one in a single year.
Source: consolidated balance sheets, FY2022 10-K (FY2021–FY2022) [17] and FY2025 10-K [18].
Net intangibles jumped from $135.0 million in FY2021 to $1,895.9 million a year later, total assets rose about 80% to $4.01 billion, and long-term debt went from $574.5 million to $1,982.4 million [19]. By FY2025 goodwill and intangibles together were $3.20 billion — about 74% of total assets, up from 40% before CGS [20]. That concentration is less alarming than it looks, because the largest single intangible is a bona fide exclusive license rather than acquisition froth — but it does mean the reported book is now mostly the carrying value of purchased franchises, tested for impairment rather than earned in cash.
The buyback that only held the line
CGS Purchase Price ($B)
ROCE FY2025
Goodwill + Intangibles / Assets
5-Year Buybacks ($B)
Source: FY2022 10-K Note 6 [21]; FY2025 balance sheet [22]; ROCE and five-year buybacks derived from reported financials, FY2021–FY2025 [23].
The five-year buyback totals about $1.0 billion, and it bought almost no share-count reduction. Diluted shares fell from 38.6 million in FY2021 to 38.4 million in FY2025 — roughly half a percent [24]. A billion dollars of repurchases essentially neutralized stock-based compensation rather than shrinking the equity; per-share compounding over the period came from the business, not from a falling count. That is not a criticism of the business — it converts cash at a high rate — but it does mean a buyer should not credit the repurchase line with per-share accretion it did not deliver.
The most recent year signals a return to the acquisitive mode. FactSet spent $243.8 million on LiquidityBook and $120.2 million on Irwin [25] [26] — order-management and investor-relations platforms bought to extend the workflow — and stepped the buyback back up to $300.5 million [27]. This reinvestment is the spending now weighing on adjusted margins, and it is the swing factor in the cash-flow growth the Margin of Safety prices.
Return on the deal
The evidence for a favorable read is concrete: ROCE at ~20% still clears the cost of capital, the acquired asset is a real exclusive-license monopoly with pricing power, leverage was rebuilt to a comfortable level within three years, and the dividend has compounded without interruption. The strongest fact against it sits in the same numbers — capital efficiency is a third lower than before CGS and has stalled around 18–20% for three years [28], the balance sheet is now three-quarters soft assets, ~$53 million a year of CGS amortization flatters the gap between reported and adjusted earnings, and an antitrust suit challenges the licensing model outright [29]. The case is most sensitive to the trajectory of ROCE: a climb back toward the pre-deal mid-20s would confirm CGS and the recent tuck-ins are earning their cost; a stall near 18–20% as amortization and legal costs persist would confirm the acquisition-led model earns less than the franchise did before.
The financial-data and analytics industry FactSet serves is a durable grower: third-party trackers put global spend at record levels, up roughly 6.5% in 2025. But the tailwind blows hardest on index licensing, ratings and private markets — segments where FactSet is under-weight — while its core buy-side workstation business faces active-to-passive and budget-consolidation cross-currents. FactSet grew revenue 5.4% in FY2025, slower than every large data peer. The tailwind is real, but it is shared, not FactSet's alone.
A slow-but-durable market, decelerating with its customers
FactSet sits inside the financial information services industry — the business of supplying data, analytics and workflow tools to asset managers, banks, wealth advisers and other investment professionals [1]. It is a large, structurally growing market rather than a fast one. Industry researcher Burton-Taylor (part of TP ICAP), the most-cited independent tracker of the sector, estimates global spending on financial market data reached a record in 2025 — on the order of $49 billion — having grown about 6.5% that year, after 6.4% in 2024 and 12.4% in 2023. These are third-party estimates, not company figures, and are not directly citable to a filing; they are used here for scale.
The shape of that series matters as much as the level. The market grew double-digits in 2023, then settled back to mid-single digits in 2024 and 2025. FactSet's own deceleration — reported revenue growth of 15.9% in FY2021 falling to 5.4% in FY2025 — is not an isolated event; it tracks an industry whose spend growth roughly halved over the same window.
Source: Burton-Taylor International Consulting (TP ICAP) industry estimates, 2023–2025 — third-party research, not a company filing.
The secular drivers behind the market are genuine. FactSet frames them consistently across its filings: rising demand for differentiated, personalized and connected data; an ongoing shift to multi-asset-class investing; and clients pushing their own digital transformations toward cloud, self-service and open APIs [2]. Its ratings-and-benchmark peers add the same list from the sell side — the growth of private credit markets, an evolving regulatory environment, and the digitization-and-AI wave that raises the value of underlying data [3]. Demand for financial data is not in structural decline. What matters for FactSet is which parts of that demand it captures.
Where the growth concentrates
The clearest read on whether the industry tailwind is reaching FactSet is the peer tape. Every large diversified data company in the corpus grew faster than FactSet in the most recent fiscal year.
Sources: FactSet FY2025 10-K [4]; MSCI [5], Moody's [6], S&P Global [7], Morningstar [8], all latest fiscal year.
The gap is not random. It reflects where in the industry each company sits. MSCI's fastest engine is index licensing, whose fees rise with the assets in passive funds tracking its benchmarks — the more money flows to index products, the more it earns. Moody's leans on ratings issuance and the expansion of private credit. S&P Global and Morningstar carry ratings, indices and private-markets data of their own. Those sub-segments — passive/index, ratings, private markets and private credit — are the parts of the industry growing fastest, and FactSet has only modest exposure to each. FactSet's revenue is concentrated in the buy-side workstation and analytics workflow: about 82% of its subscription value comes from buy-side clients, and roughly 18% from the sell side [9]. That is the more mature, more contested slice of the market — the place the moat is strongest (Moat and AI) but the ambient growth is slowest.
The cross-currents specific to FactSet's slice
Where index and ratings peers ride the same trends as pure tailwinds, two of the industry's structural shifts cut against FactSet's model directly, and it says so in its own risk factors.
The first is the move from active to passive investing. FactSet's revenue is tied to active managers — the professionals who research, screen and trade, and who therefore pay for workstations and analytics. As capital shifts to low-cost passive vehicles that "require little decision-making by investment managers," FactSet concedes that demand for its products could fall [10]. The same shift that inflates MSCI's index fees deflates FactSet's user base. It is a headwind and a tailwind depending on which side of the trade a company sells to.
The second is client consolidation and cost rationalization. FactSet's customers are under margin pressure of their own, and when they cut, they concentrate spend with fewer vendors, choose lower-cost offerings, or bring data in-house — any of which can shrink FactSet's footprint [11]. In a market where Bloomberg, S&P Global and LSEG all compete for the same terminal budget, "consolidate with fewer suppliers" is a live risk for the smallest of the majors, not a hypothetical.
The industry's two biggest secular shifts — passive investing and vendor consolidation — are tailwinds for index and ratings franchises but headwinds for a buy-side workstation business. FactSet is on the exposed side of both.
Where FactSet does catch the tailwind
The picture is not one-directional. FactSet has real exposure to the industry's faster sub-currents, and its own reporting shows those pockets growing well ahead of the group average. In the most recent quarter, wealth management — where the industry is digitizing adviser desktops and where FactSet already integrates more than 15 million wealth portfolios [12] — grew organic subscription value 10%, displacing incumbents with six-figure wins [13]. Asia Pacific, where regional firms are modernizing their technology stacks, grew 8%; the Americas grew 6%; while the mature institutional buy side grew 4% and EMEA 4% [14].
Source: FactSet Q1 FY2026 earnings call [15].
The growth is dispersed. FactSet's blended organic growth is mid-single digits, but that average hides a double-digit wealth business and a high-single-digit Asia-Pacific business pulling against a low-single-digit legacy buy side. The company also positions its data-feed and "AI-ready data" business (CTS) to sell the raw content that clients and their AI models increasingly consume — a way to earn on the data-proliferation trend even where it is not selling the terminal (Moat and AI). The tailwind reaches some FactSet products far more than others.
The demand-side read
The demand-side case supports the middle of the road, not either extreme. The industry is a durable grower that will very likely keep expanding at a mid-single-digit pace, which sets a floor under FactSet's subscription base. But the industry is not growing fast enough — and FactSet is not positioned in its fastest corners aggressively enough — to reclaim the double-digit growth its multiple once assumed. FactSet grew slower than every large peer in FY2025, and the two biggest structural shifts in its market work against its core.
The strongest fact against that cautious read is FactSet's own recent acceleration: organic ASV growth troughed at 4.8% in FY2024 [16] and had recovered to 5.7% by the end of FY2025 [17], with the wealth and international vectors showing the company can lever the higher-growth sub-segments when it wins there. What would change the read is durability in those vectors: if wealth and Asia Pacific hold double-digit and high-single-digit growth for several years while the buy side stops shrinking, FactSet grows with — or slightly ahead of — its market rather than behind it. The line item to watch is the quarterly organic-ASV split by region and firm type in the earnings decks, where that divergence shows up first.
Private markets and private credit are the fastest-growing pocket of the financial-data industry, and it is the pocket where FactSet is thinnest. About 82% of its subscription value sits with buy-side clients in mature, public-market workflows [1]. Its answer to private markets is an embedded, sub-scale push — the 2021 Cobalt deal, a multi-year data build — not a standalone franchise. The scaled pure-plays, Morningstar's PitchBook and MSCI's Private Capital Solutions, already own the category.
This chapter picks up the thread Industry Tailwinds left open — whether FactSet is gaining or losing the private-markets race. The evidence shows it monetizing private data as a workflow adjacency rather than trying to out-build the incumbents — a lower-cost path that is unlikely, on its own, to power a durable re-acceleration.
A public-market franchise, by design
FactSet's revenue base is concentrated where the industry grows slowest. Buy-side clients — asset managers, hedge funds, asset owners, wealth managers — account for roughly 82% of Organic ASV; the sell side is the other 18% [2]. Geographically the business is a North American franchise: the Americas produced $1,506M of FY2025 revenue, 64.9% of the total, with EMEA at 25.0% and Asia Pacific at 10.1% [3].
Buy-side share of ASV
Sell-side share of ASV
Americas share of revenue
Each metric is a separate row. Source: FY2025 Annual Report, Item 1 Business [4] and Revenue by Geographic Segment [5].
That mix is the moat's home ground (Moat and AI) — deep public-market data, portfolio analytics, terminals with high switching costs. It is also the part of the industry where ambient growth is mid-single digit and shared with every large peer. The faster money is moving toward private capital, and FactSet has to reach for it from a standing start.
What FactSet actually has
FactSet's private-markets presence is real but embedded — spread across products rather than reported as a line. Three pieces define it.
The anchor asset is Cobalt Software, acquired in October 2021 for about $51.0 million. FactSet called it "a leading portfolio monitoring solutions provider for the private capital industry" and said the deal "expands our private market offering" [6]. Cobalt serves general partners monitoring their portfolios — a workflow tool, not a private-company database of the kind that anchors the pure-plays.
The second piece is content. Management describes "the largest content expansion in FactSet's history," built around three themes: deep sector, private markets, and real-time [7]. Private-markets data is being layered into the existing platform rather than sold as a separate franchise.
The third piece is the client channel. FactSet's Dealmakers firm type serves "investment bankers, sell-side research analysts, corporate users, investor relations officers, and private equity and venture capital professionals," offering "global coverage of public and private markets" in one workflow [8]. The strategic logic is integration — public and private in a single view — not a standalone private-capital product. Management has framed the private-markets opportunity as reaching "private equity, corporates, and hedge funds where we may not have been as active previously" [9]. That language describes a build into territory the company concedes it under-served.
Notably, FactSet discloses no separate private-markets revenue or ASV line. The effort is visible in strategy and acquisitions, not yet in a quantified growth number a reader can track.
The scaled pure-plays own the category
The gap becomes concrete against the two competitors that report private markets as a business. The contrast is not close.
"Latest revenue / run-rate" is PitchBook FY2025 revenue and MSCI Private Assets run rate as of Dec 31, 2025. Sources: Morningstar FY2025 10-K, PitchBook segment [10]; MSCI FY2025 10-K, Run Rate [11]; FactSet FY2021 10-K [12].
Morningstar's PitchBook is a dedicated private-capital data business: FY2025 revenue of $671.8 million, up 8.6%, at a 31.3% operating margin [13]. It covers the full lifecycle of venture capital, private equity, private credit and M&A, and serves roughly 10,200 client accounts and 113,451 licensed users [14]. One product line, aimed only at private markets, generates revenue equal to roughly 29% of all of FactSet — and grows faster than FactSet as a whole.
MSCI built its position by acquiring Burgiss. Its "All Other – Private Assets" run rate — essentially Private Capital Solutions — reached $292.0 million at the end of 2025, up 9.5% (7.4% organic) [15]. Both pure-plays grow their private-markets books several points ahead of FactSet's 5.4% company-wide revenue growth.
Growth rates: PitchBook FY2025 revenue +8.6% [16]; MSCI Private Assets run rate +9.5% [17]; FactSet FY2025 total revenue +5.4% [18].
S&P Global and Moody's are pushing into private credit from ratings; MSCI is extending from benchmarks. The category is being contested by companies larger than FactSet, each with a scaled, disclosed private-markets asset. FactSet enters it with a $51 million monitoring tool and a content-expansion program.
Gaining or losing
On the plain evidence, FactSet is a follower here, not a share-taker. There is no disclosed private-markets revenue line, no private-company database built to rival PitchBook, and management's own language — territory "where we may not have been as active previously" [19] — describes catch-up, not leadership. The single fastest-growing vertical in FactSet's industry is one where it is structurally under-indexed, and the re-acceleration examined in Financial Record is being carried by wealth and Asia Pacific, not by winning private capital.
The strongest fact against that read is that FactSet may not need to win the category head-on. Its bet is integration: private-markets content flowing into the public-market workflows its 82% buy-side base already runs, and into a Dealmakers franchise that grew organic ASV 6% in the most recent quarter, led by banking, with private-equity and venture-capital clients contributing [20]. That path monetizes private data across a large installed base without the cost of out-building an incumbent — a narrower ambition, but a cheaper and possibly more defensible one.
The read that fits the evidence: private markets is contested ground where FactSet is a coherent late challenger, not a leader, and it is unlikely to be the engine of a durable growth inflection. What would change that view is specific and falsifiable — a disclosed, quantified private-markets ASV line growing at a double-digit rate, or a scale acquisition on the order of MSCI's Burgiss deal. Until one of those appears, the prudent assumption is that the industry's fastest dollars keep accruing mostly to others.
The report's parts now sit on the table: a subscription franchise with retention above 95%, a de-rating from $495.72 to $262.46, organic growth re-accelerating to 7.1%, a margin trough, and an AI question that cuts both ways. This chapter reconciles them. At $262.46 the market pays roughly 15x forward adjusted earnings for a business growing organic subscriptions in the mid-single digits — a price that sits just above the sell-side mean target of $254 and implies almost no long-run growth, while the operating momentum that would justify more is real but not yet proven durable.
Where the reference points stand
Share Price (16 Jul 2026)
Sell-Side Mean Target
FY2026 Adj EPS Guide (mid)
FY2027 Adj EPS Consensus
Sources: share price and consensus targets/estimates per market data feed, as of 16–17 Jul 2026; FY2026 adjusted EPS guidance $17.25–$17.75 midpoint, Q3 FY2026 earnings presentation [1].
The current price captures the tension directly. It has recovered from a 52-week low of $190.06 but remains roughly 47% below the November 2024 peak, and it now trades a few dollars above the sell-side mean target of $254 and above the median of $246.50 — so the average analyst sees the stock as slightly ahead of fair value even after the de-rating. The margin-of-safety case (Margin of Safety) rests not on that target but on the reverse-DCF: at $262.46 the price discounts only about 2.3% perpetual free-cash-flow growth, against organic subscription growth that has just printed 7.1%. Whether that gap is opportunity or fair value is the question the rest of this chapter tests.
The state of play, reconciled
Each row below is a fact the report has established, read two ways, with the evidence that would settle it. None of these is decided by rhetoric; each is decided by a specific disclosure on a specific date.
| Established fact | The constructive read | The skeptical read | What settles it |
|---|---|---|---|
| Organic ASV growth reached 7.1% in Q3 FY2026 — the fifth straight quarter of acceleration and the fastest since Q1 FY2024 | A genuine inflection: sales execution and AI demand are re-igniting the top line | Still below the high-single/double-digit rates of the franchise's best years, and Q3 is aided by a seasonally strong close; the industry itself grows ~6.5% | FY2027 organic ASV guidance and the Q4 (seasonally largest) print, both due 17 Sep 2026 |
| Over 10% of Q3 ASV growth came directly from AI SKUs; over 20% of the top 100 clients use MCP on a paid basis | The AI flywheel is monetizing — connected data and embedded workflows are proving to be a moat, not a vulnerability | Discrete AI revenue is still small against a $2.5B base, and a large index/ratings peer frames generative AI as a disintermediation threat to the data-terminal model | Disclosure of discrete AI-SKU ASV and whether AI consumption sustains retention and product upsizing |
| Adjusted operating margin is guided to 34.0%–35.5% for FY2026, down from the 36%–37% guided a year earlier | An investment trough — the new team sees a "clear path to expanding margins" once the technology-consolidation spend rolls off | The step-down could prove structural if AI infrastructure, token, and compensation costs stay elevated | The FY2027 margin guide on 17 Sep 2026 — recovery toward 36% versus another flat year |
| At $262.46 the price implies ~2.3% perpetual FCF growth and trades near 15x forward adjusted EPS | Undemanding for an above-95%-retention franchise re-accelerating to 7.1% — the priced-in pessimism is the opportunity | Not absolutely cheap for a mid-single-digit grower, and the price already sits above the sell-side mean target | Whether estimate revisions — currently trending up — keep rising and pull targets above spot |
The four rows turn on the same event — the fiscal 2027 outlook management issues alongside Q4 results on 17 September 2026. It is the first hard read on whether the ASV acceleration and the AI monetization survive into a fresh guidance year, and whether the margin step-down was a trough or a new level.
The improving trajectory management has already signaled
Through fiscal 2026 the company raised its own guidance once and then held it — organic ASV guidance moved up at the second quarter and the adjusted-EPS range with it, then both were reaffirmed at the third quarter. That is the shape of a business meeting a plan rather than chasing one.
Source: FY2026 adjusted EPS guidance revised from $16.90–$17.60 (18 Dec 2025) to $17.25–$17.75 (31 Mar 2026) and reaffirmed (1 Jul 2026), FactSet earnings presentations [2] [3].
The current fiscal-2026 outlook — organic ASV growth of $130M–$160M (~5.4% to ~6.7%), revenue of $2,450M–$2,470M, and adjusted EPS of $17.25–$17.75 [4] — brackets the base case below. What the guidance does not yet answer is fiscal 2027, and that is where the three scenarios diverge.
Three ways the next two years resolve
The scenarios below hold the through-line's variables — ASV durability, AI monetization, and the margin trough — at three settings, and attach the fair-value bounds the valuation work derived (Margin of Safety). They are not probabilities; they are the range the evidence currently supports and the drivers that move a reader between them.
Sources: driver settings anchored to FY2026 guidance [5] and Q3 FY2026 AI-monetization disclosure [6]; fair-value bounds derived in the valuation analysis (Margin of Safety).
The base case is close to what the company already guides and what consensus already carries: revenue near $2.47B in FY2026 and adjusted EPS building toward the FY2027 consensus of $19.67, roughly 10.5% above FY2026. At $262.46 the price is inside the lower half of the base-case fair-value band, which is why the sell-side mean sits a touch below spot rather than far above it — the moderate-growth outcome is largely in the price. The asymmetry a value buyer is paid for lives in the bull column: if the 7.1% ASV rate and the AI flywheel prove durable and the margin trough reverses, the combination of faster growth and a re-rated multiple reaches the high-$300s. The bear column is the discipline on that hope — a re-deceleration toward the industry's ~6.5% ceiling with a margin that does not recover pulls fair value back toward, and below, today's price.
What to watch, and what would move the read
Watch items are only useful if they are falsifiable. Each row names the event, the line item, the threshold that changes the read, and which way the surprise risk runs. They are ordered by decision value.
Sources: next earnings date and revision data per market data feed (as of 17 Jul 2026); FY2026 guidance [7]; AI-SKU and MCP metrics from the Q3 FY2026 call [8] [9]; CEO priorities [10].
Two details sharpen the top watch item. First, the September print is the highest-information event on the calendar precisely because recent quarters have been quiet: the last three reports beat consensus by only 3.5%, 1.9%, and 1.8%, so a fiscal-2027 guide is where a real surprise can come from, not the quarter's EPS. Second, the one recent miss was the fiscal-2025 fourth quarter reported in September 2025 — the same seasonally largest quarter — which is why a strong FY2027 guide would carry more weight than usual.
The execution machinery behind the numbers is new and still unproven. CEO Sanoke Viswanathan, a 15-year JPMorgan veteran who ran its international consumer and wealth business, joined in September 2025 [11] and set three priorities: commercial excellence, productivity, and long-term strategy [12]. The commercial-excellence program — re-cut sales incentives, disciplined pipeline, tighter pricing — is the mechanism that would keep ASV growth at 7% rather than let it fade to the industry rate; the productivity program, consolidating legacy technology onto a modern platform, is the mechanism that would reverse the margin trough. Both are asserted, not yet demonstrated. The scoreboard is the same two numbers already in the watch list: organic ASV growth and adjusted operating margin. Roughly ten months in, the ASV line is cooperating and the margin line is not — which is exactly the split the September guide has to resolve.
What remains genuinely undecided
The report can state plainly what it knows: the balance sheet makes bankruptcy risk remote (De-Rated Compounder), retention above 95% every year makes the subscription base durable (Moat and AI), and the de-rating has removed the premium the stock once carried (Margin of Safety). What it cannot yet state is whether the 7.1% ASV acceleration is a durable inflection or a cyclical bounce flattered by a seasonally strong close, and whether the margin step-down reverses. At $262.46 — just above the sell-side mean and pricing in barely 2% long-run growth — a buyer is paid a modest margin of safety to wait for that answer, with the downside bounded by a franchise that does not break and the upside gated by a re-acceleration that is real but unproven at the margin. The fiscal-2027 guidance on 17 September 2026 is the first date that converts the question into evidence.