FactSet Research Systems Inc.'s management explains the business in its own materials. The slides below do the most of that work, pulled from the documents preserved in Sources. Each source link opens the complete presentation at that slide in a new tab.
FactSet's fullest current self-portrait: what the platform is, how it grows, its scale and segment mix, and the FY26 margin picture. · Open the full document →
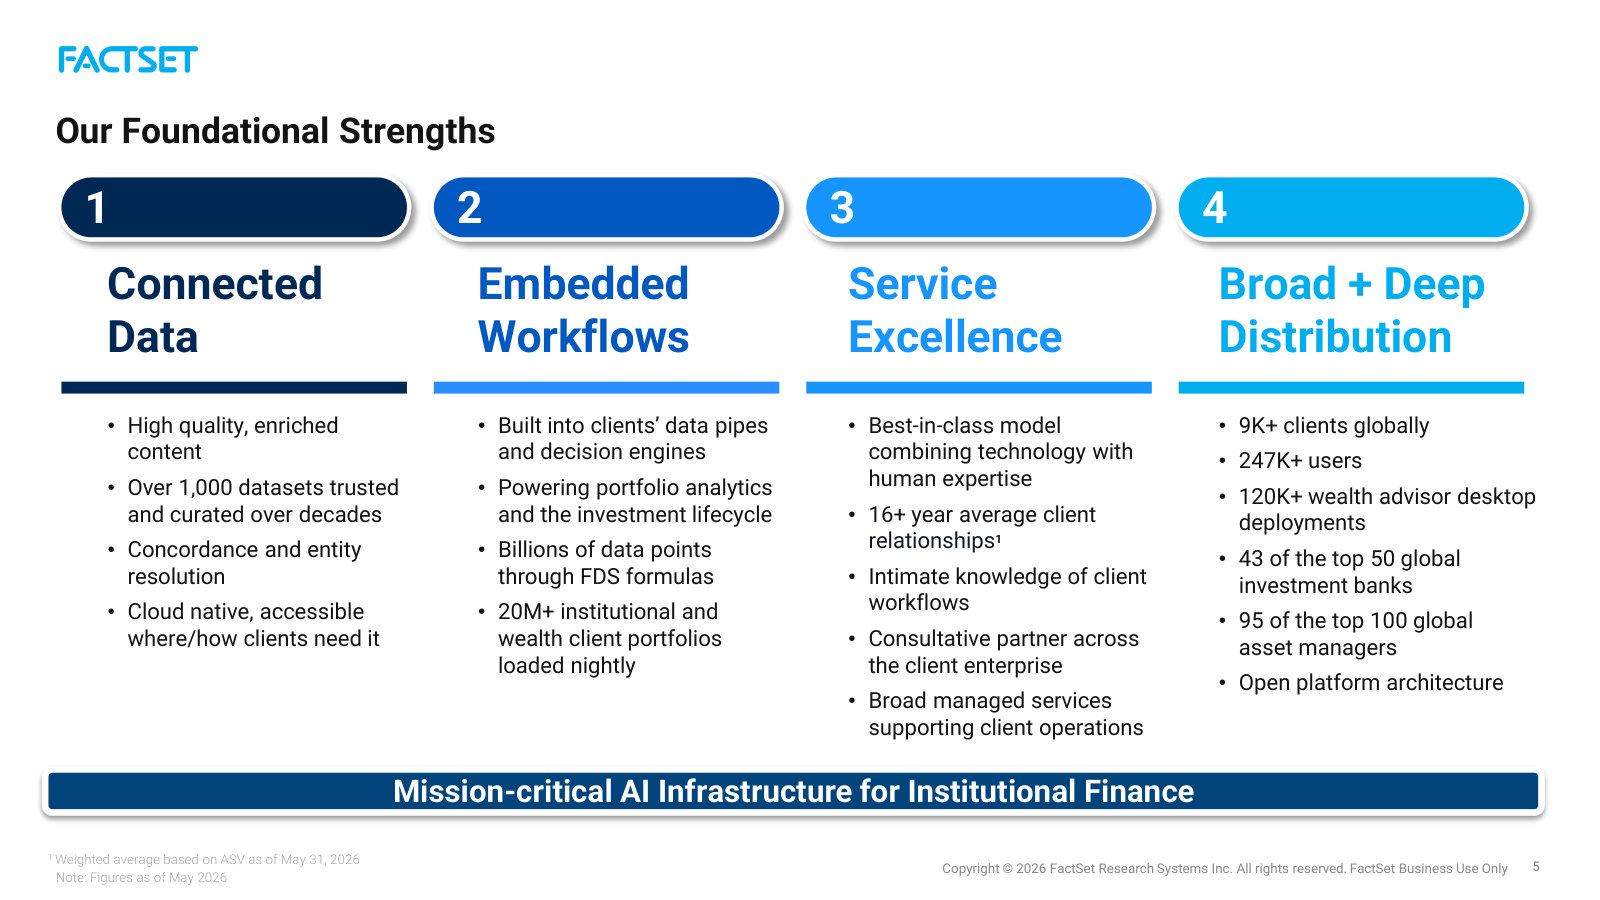
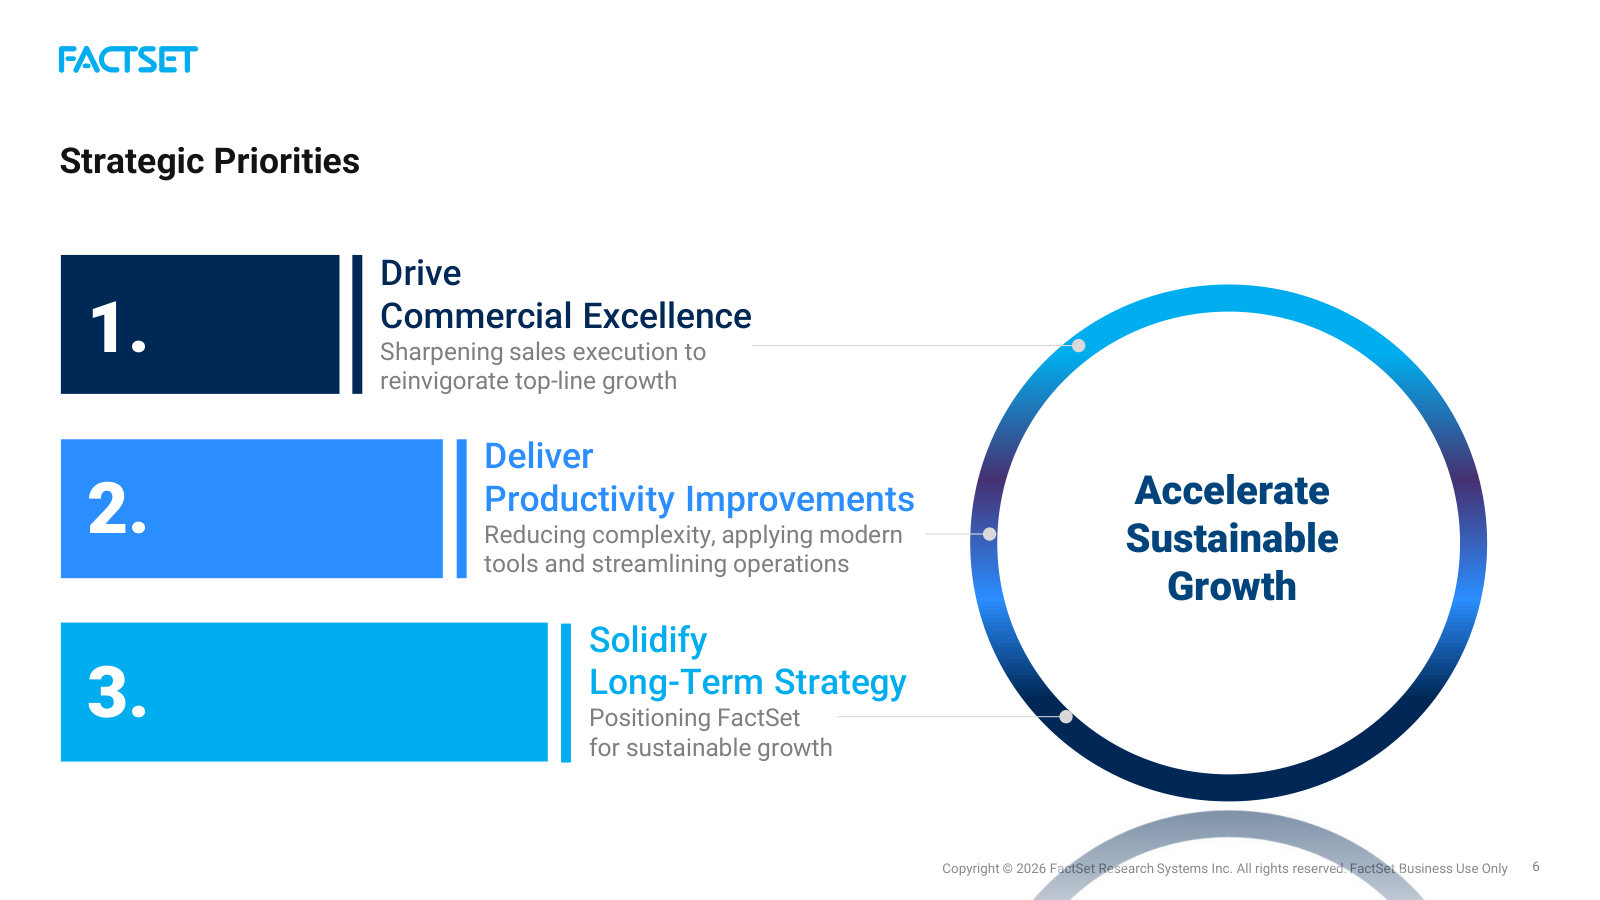
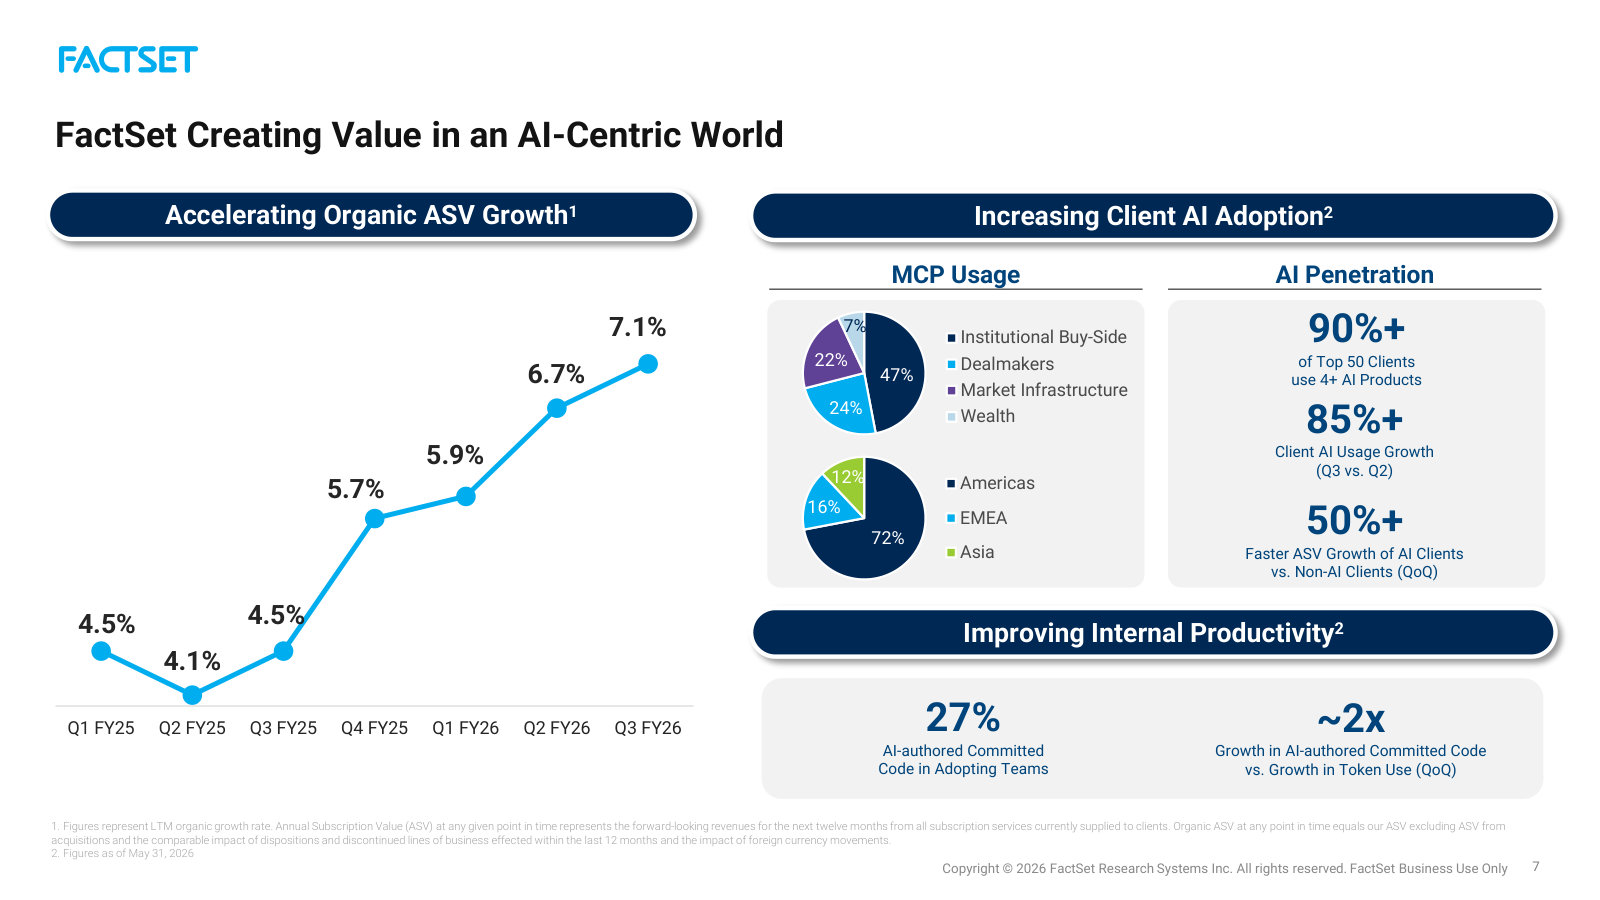
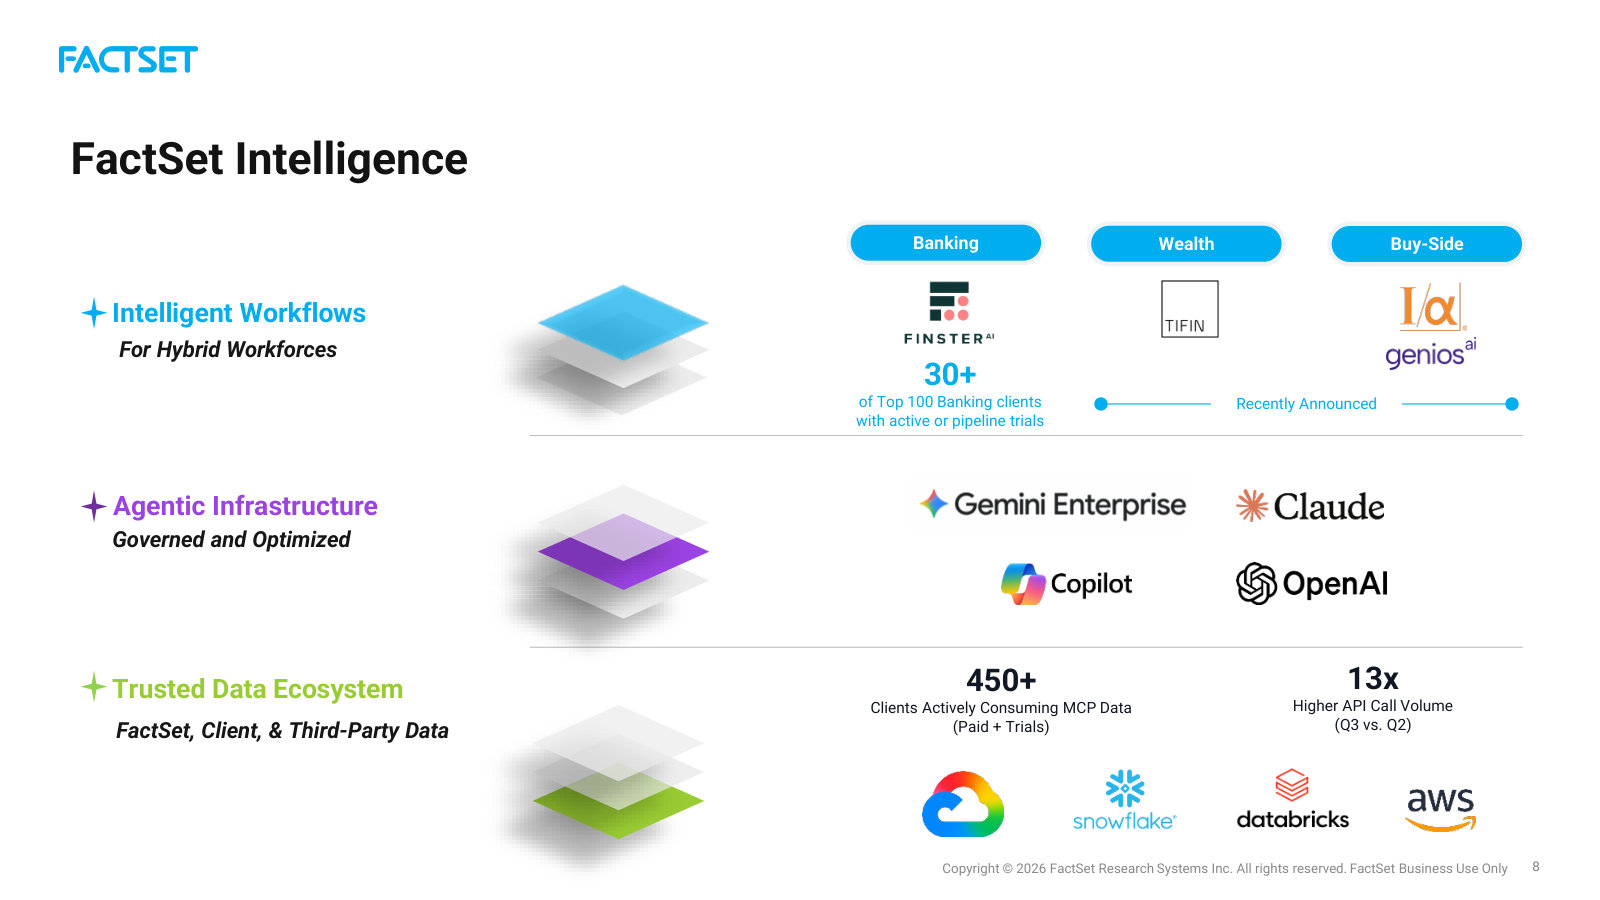
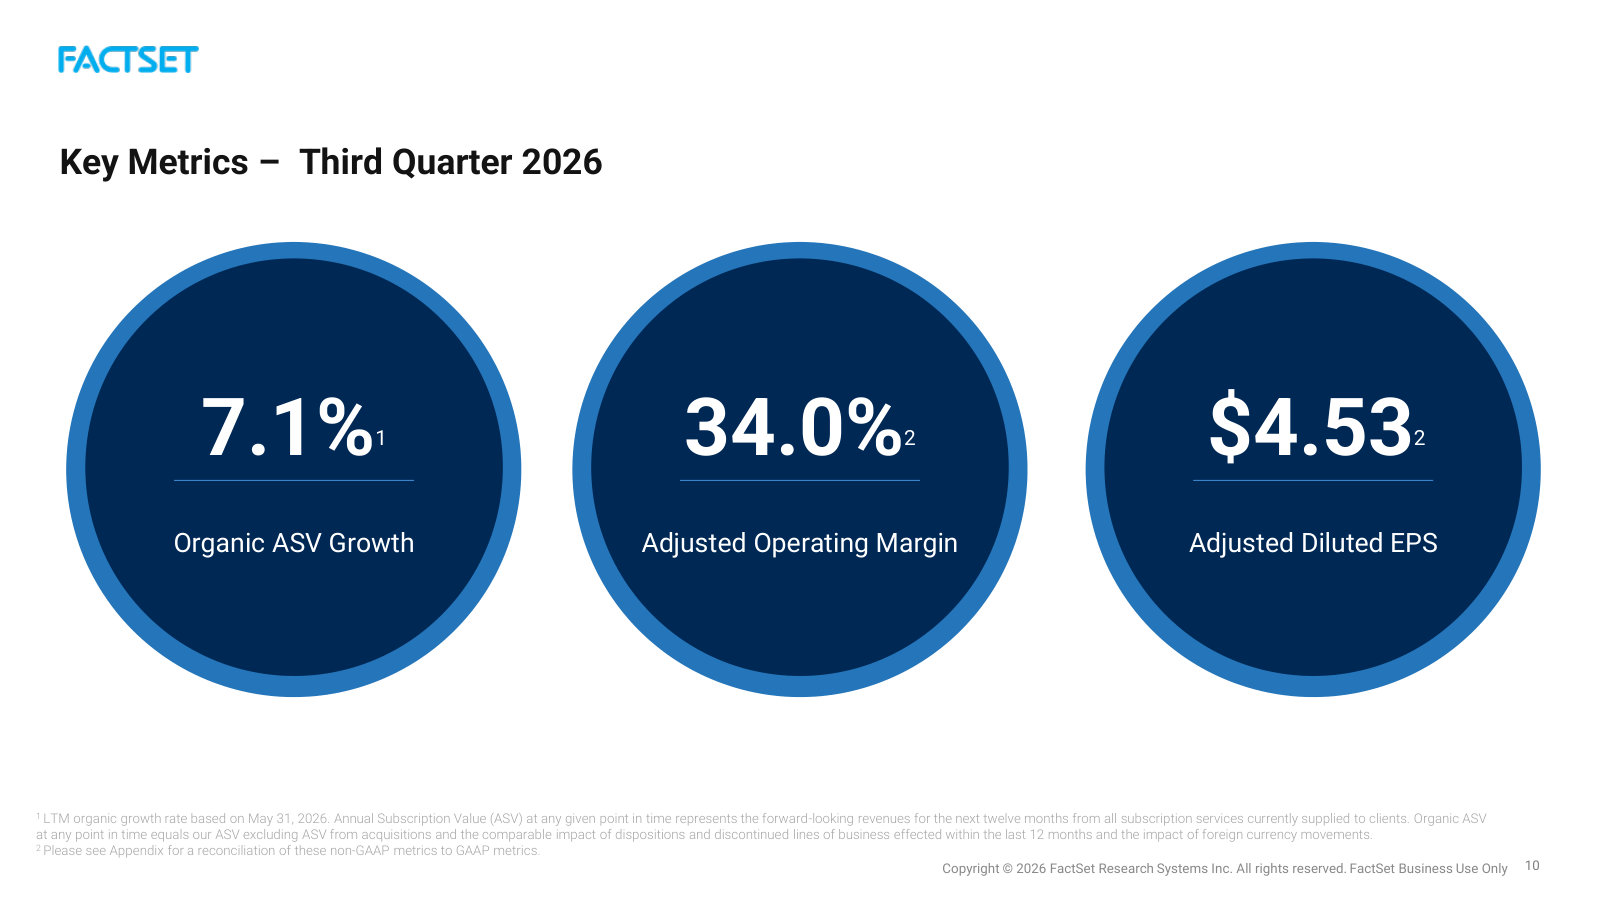
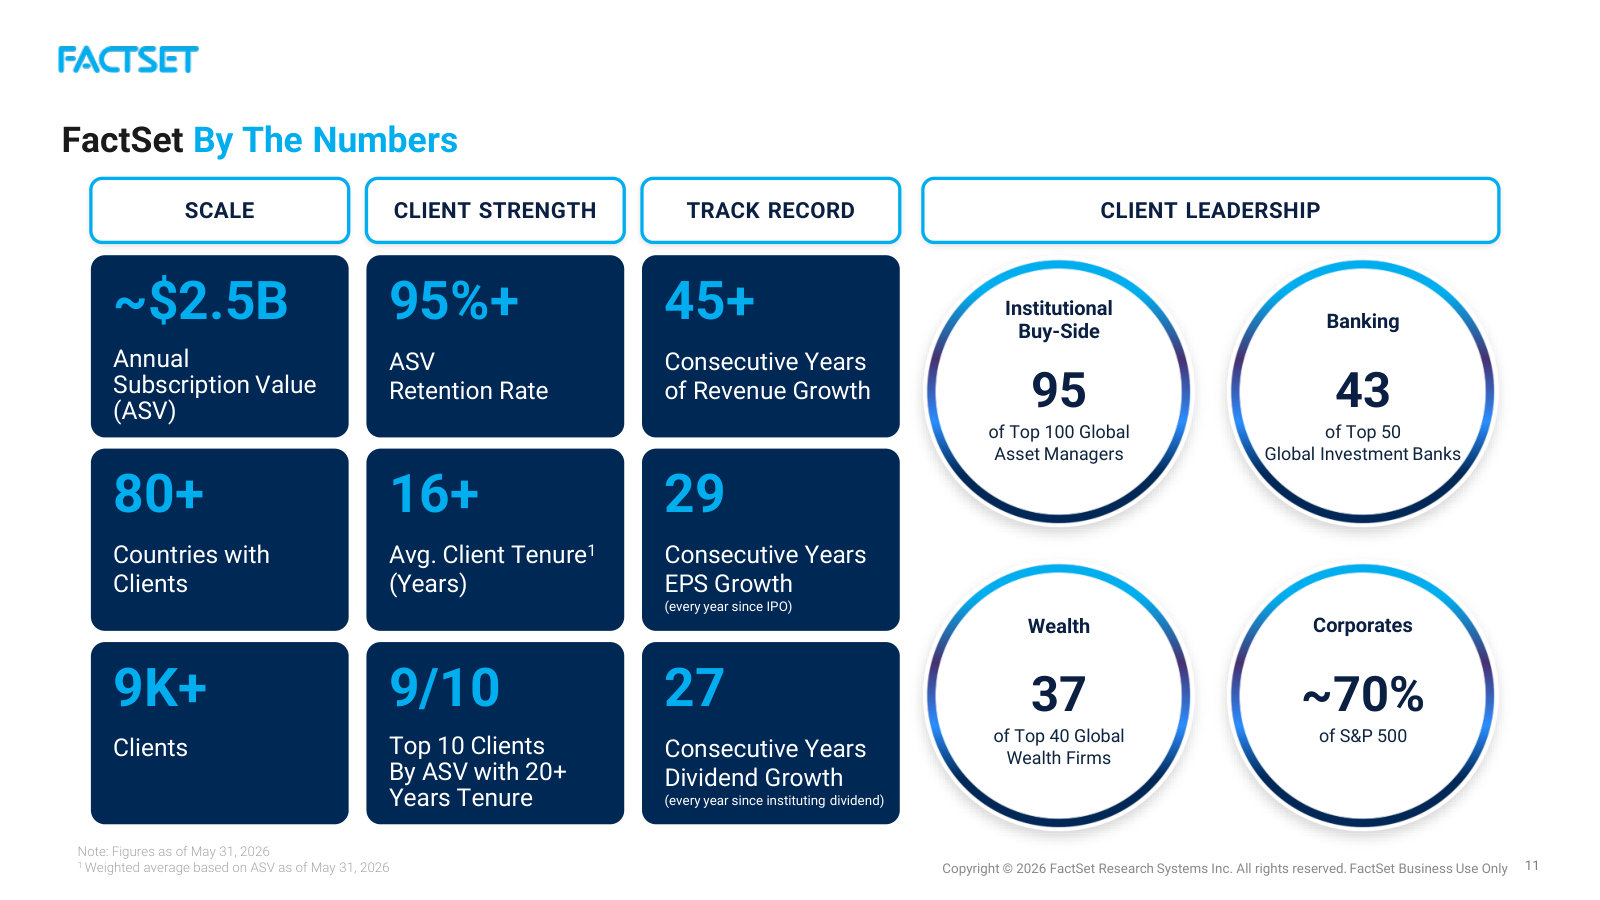
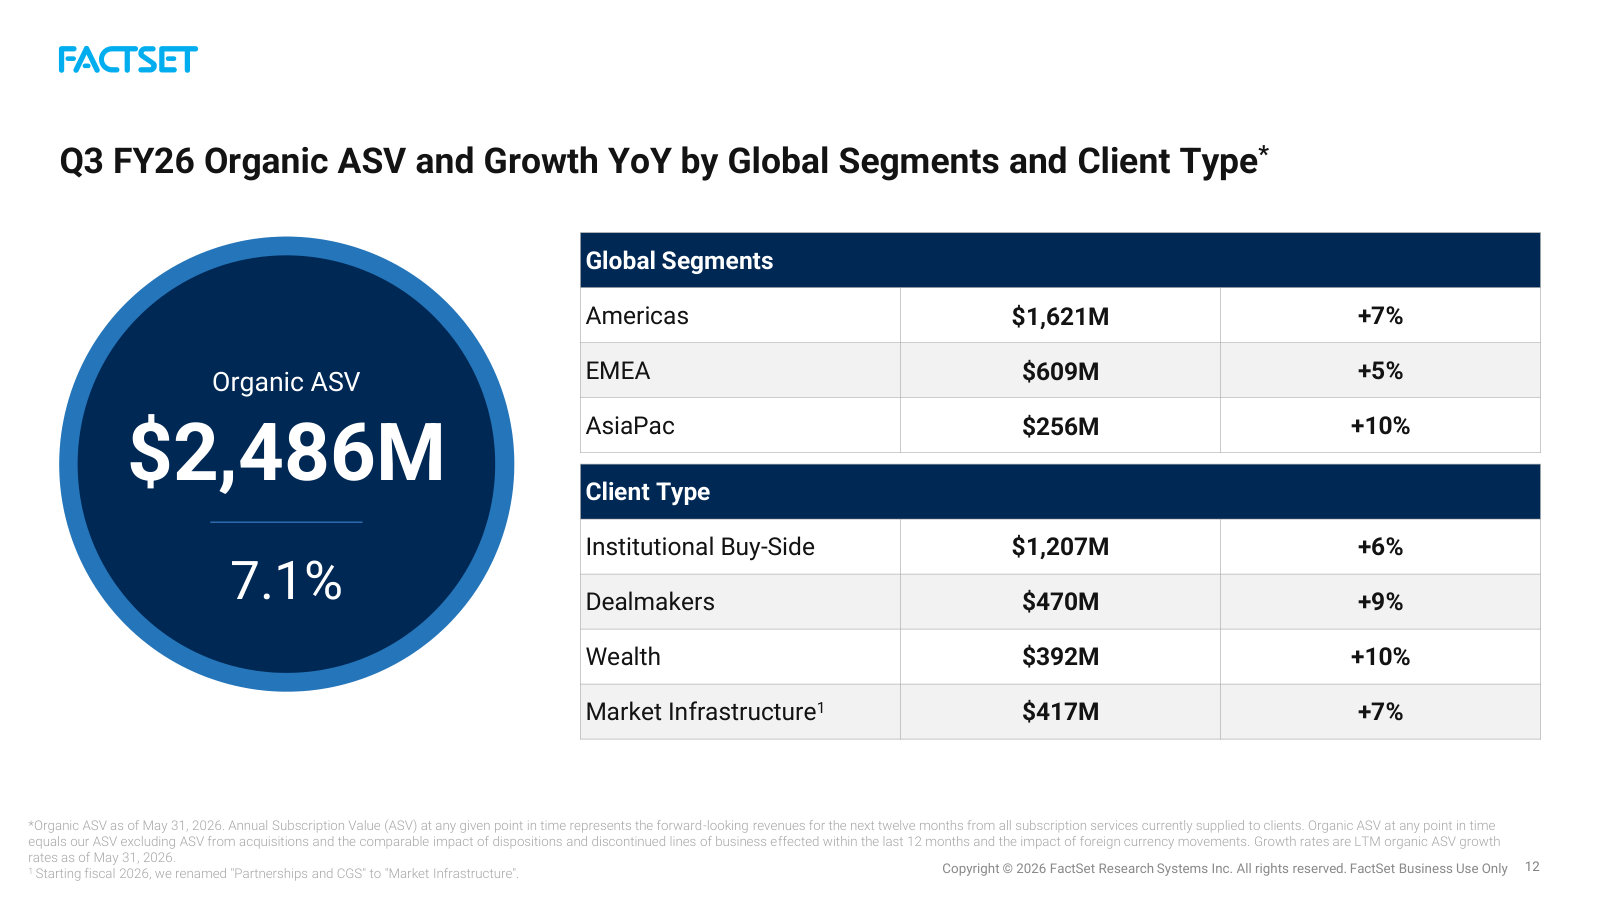
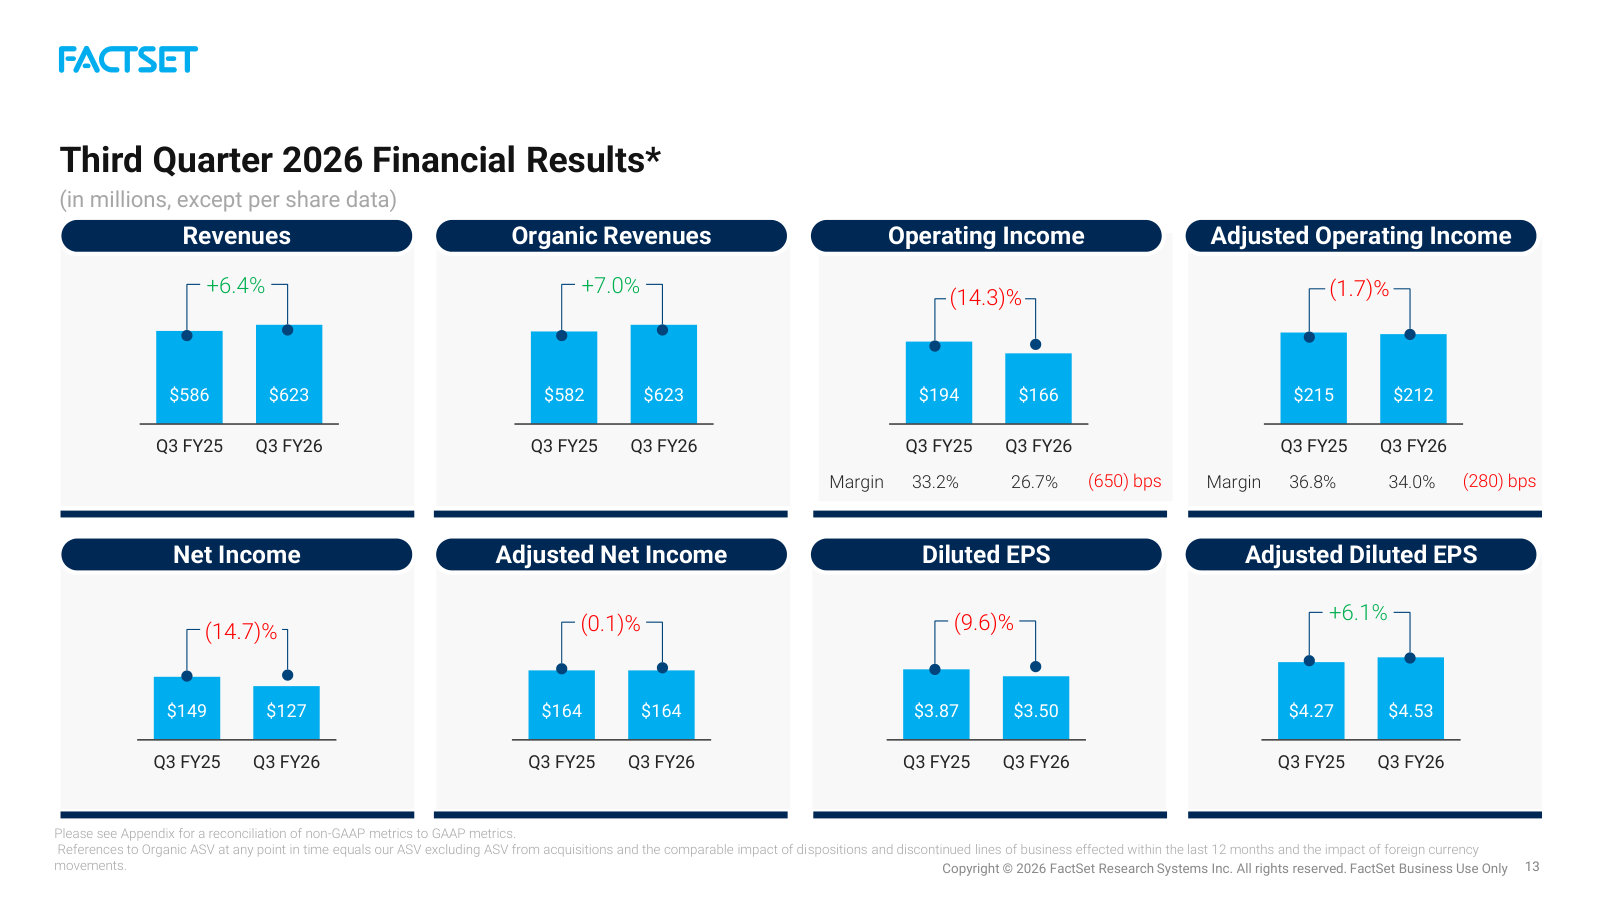
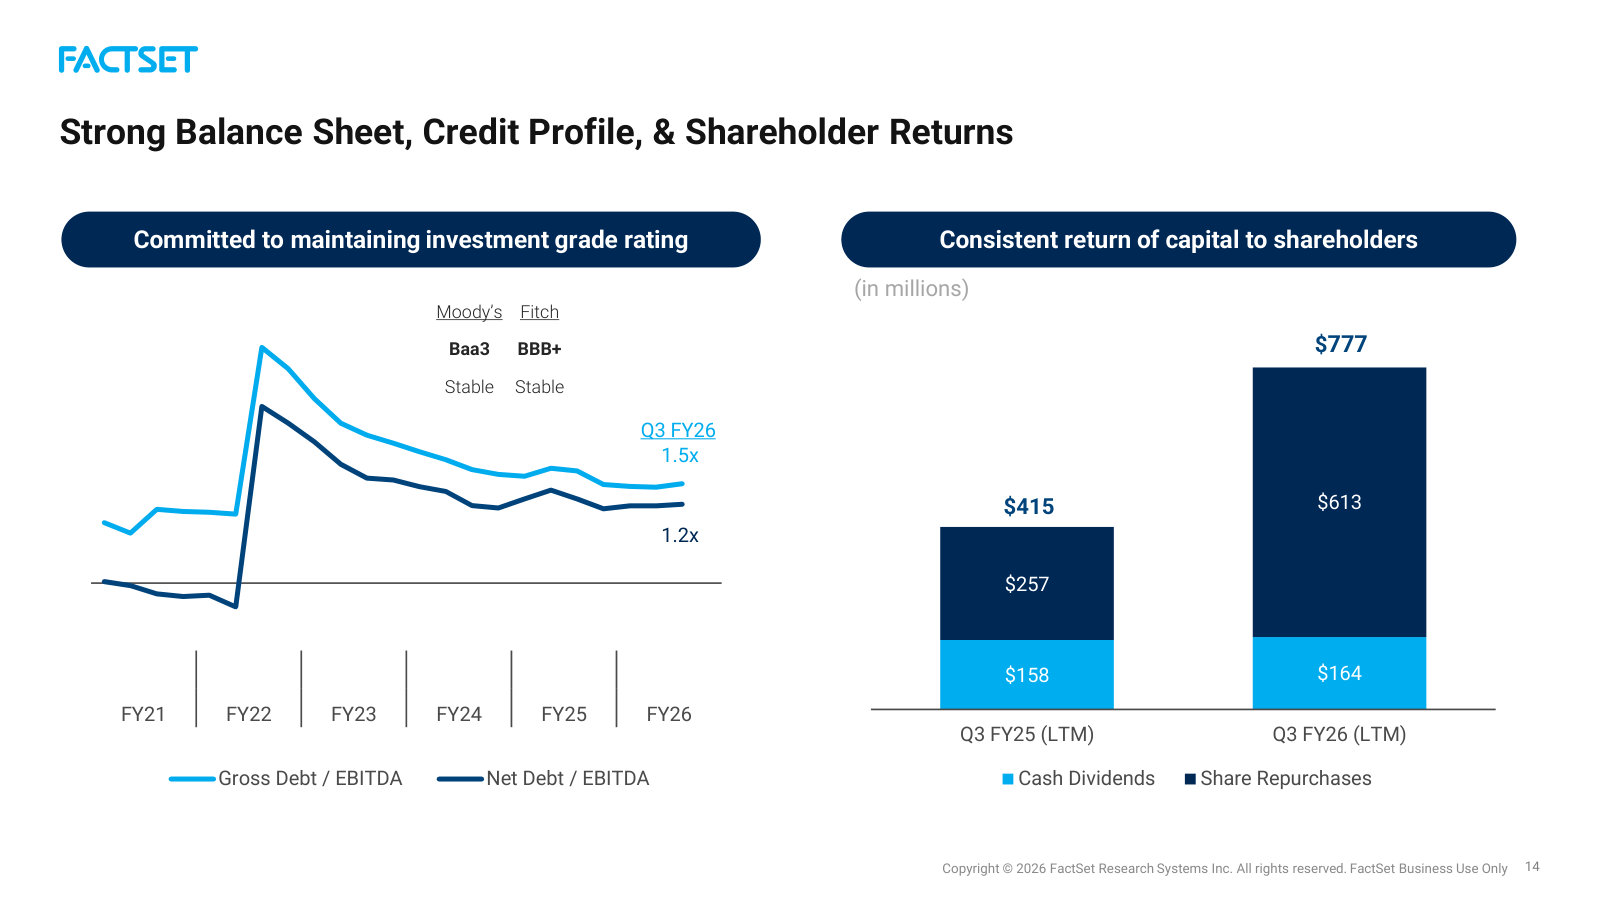
p. 5 — The four pillars — connected data, embedded workflows, service, distribution — with the client and coverage counts behind each. · Open the full presentation →p. 6 — The current playbook in one frame: sharpen sales, cut complexity, position for long-term growth — what this team is executing against. · Open the full presentation →p. 7 — Organic ASV growth reaccelerating from 4.1% to 7.1%, shown next to how fast top clients are adopting FactSet's AI products. · Open the full presentation →p. 8 — How FactSet positions in AI — its workflow, agentic and data layers, and where it plugs into Claude, OpenAI, Snowflake and other partners. · Open the full presentation →p. 10 — The headline quarter in three numbers: organic ASV growth, adjusted operating margin, and adjusted diluted EPS. · Open the full presentation →p. 11 — The franchise at a glance — ~$2.5B ASV, 95%+ retention, 45+ years of revenue growth, and its grip on the largest banks and asset managers. · Open the full presentation →p. 12 — Where the ~$2.5B of subscription value comes from and how fast each piece grows — by region and by client type. · Open the full presentation →p. 13 — The FY26 story in one exhibit: GAAP operating income and margin down as investment ramps, while adjusted EPS still rises. · Open the full presentation →p. 14 — Investment-grade balance sheet and the rising cash returned to shareholders through dividends and buybacks. · Open the full presentation →
Explains the moat and the FY26 investment cycle: why the data is hard to leave, how the analytics work, and where money is going. · Open the full document →
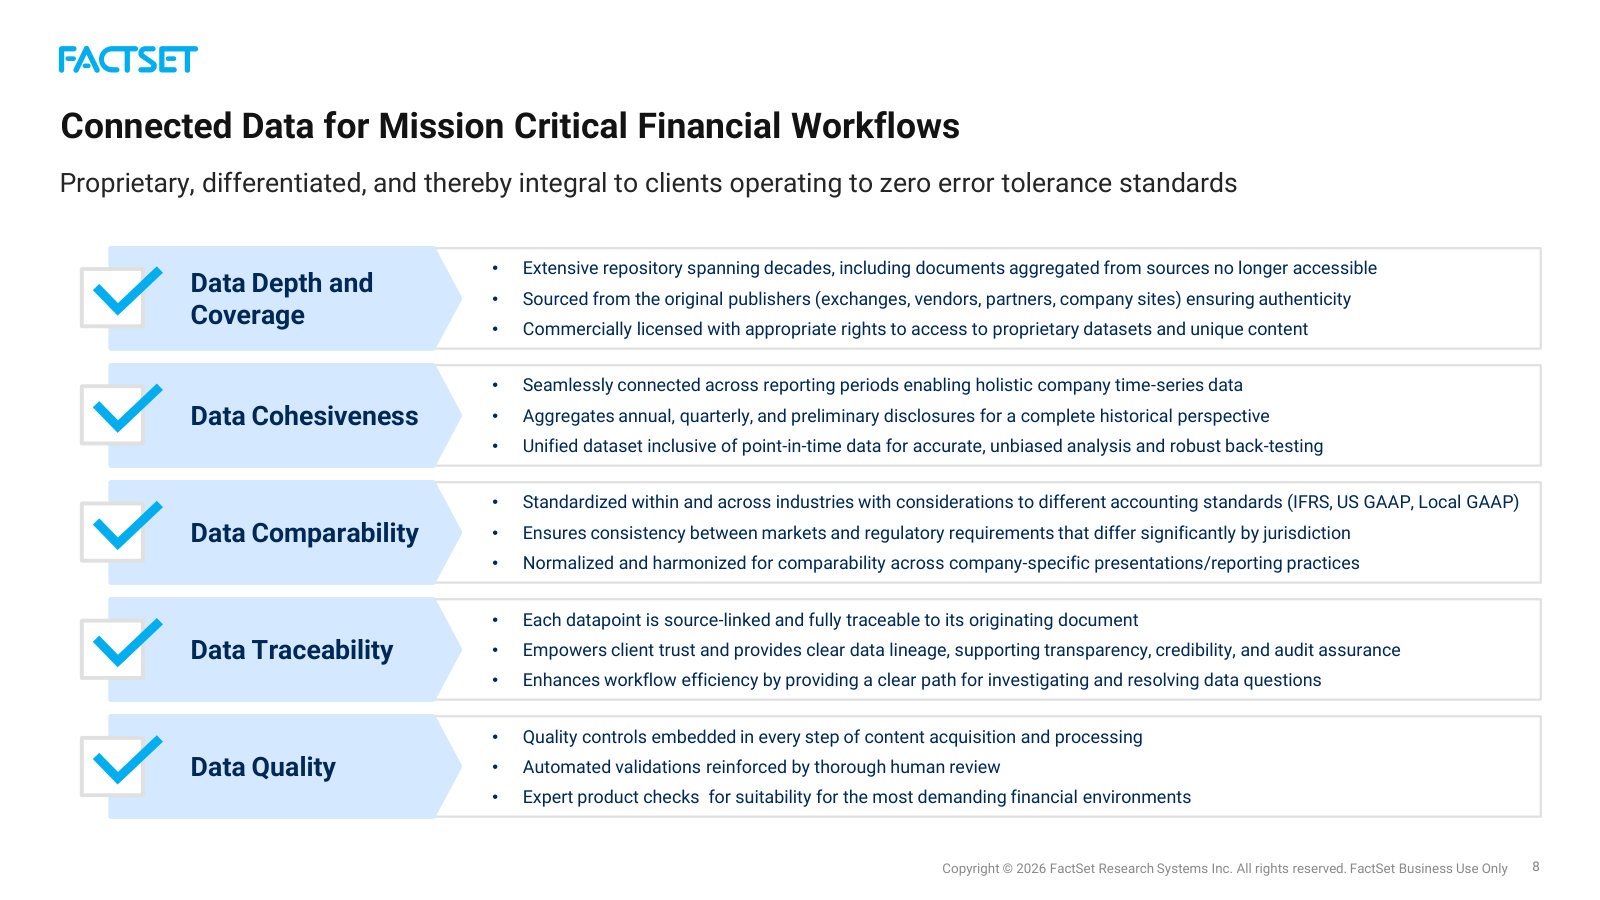
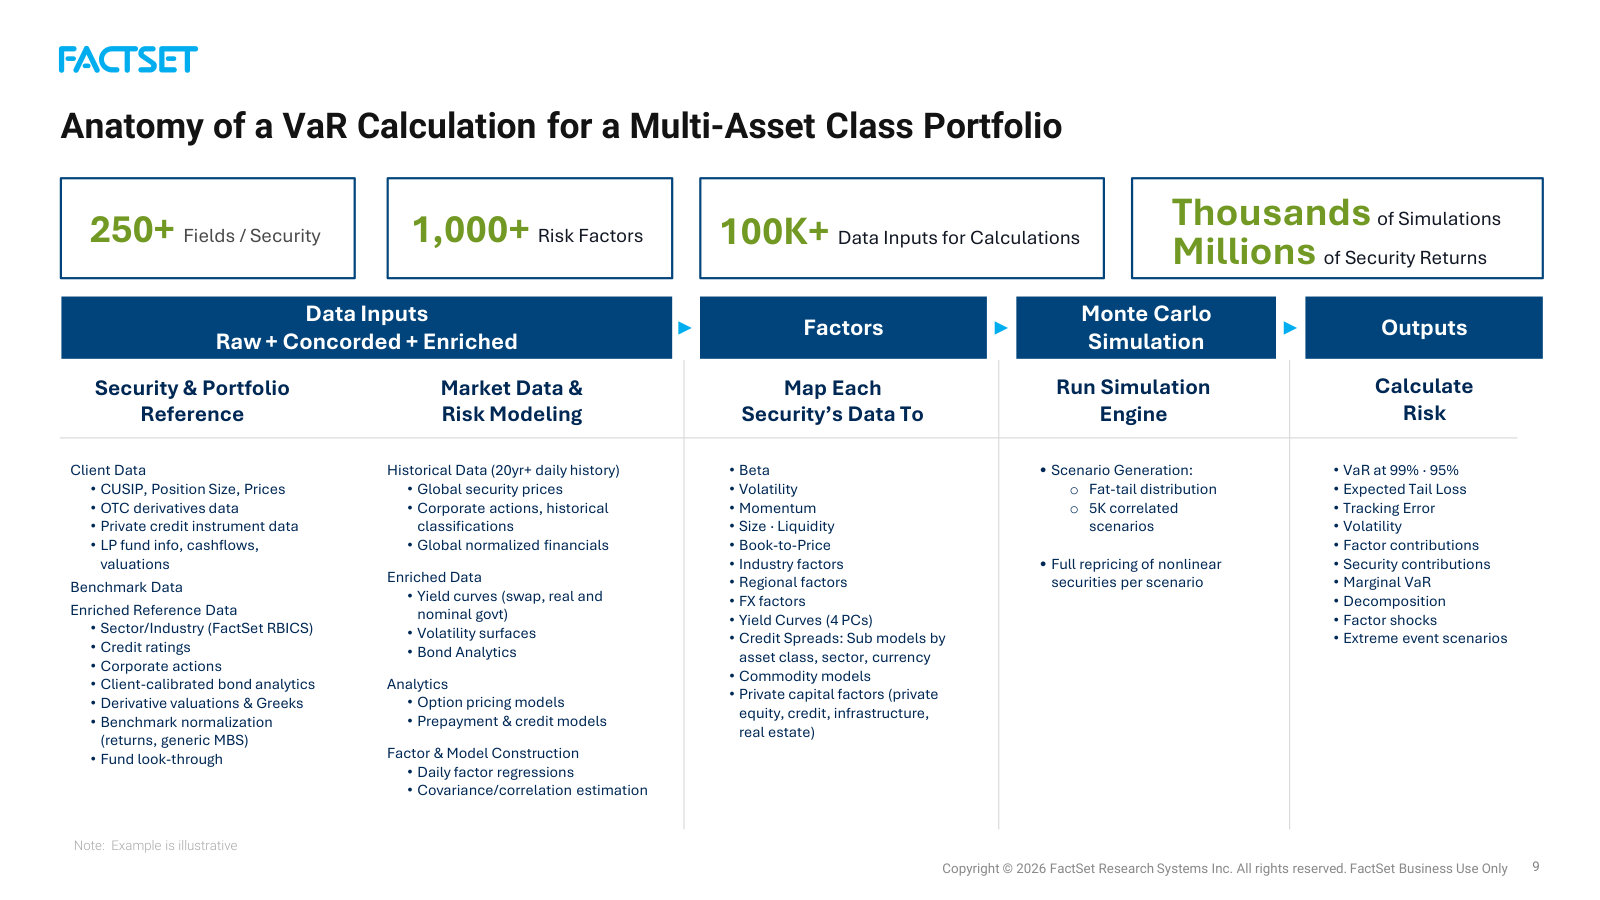
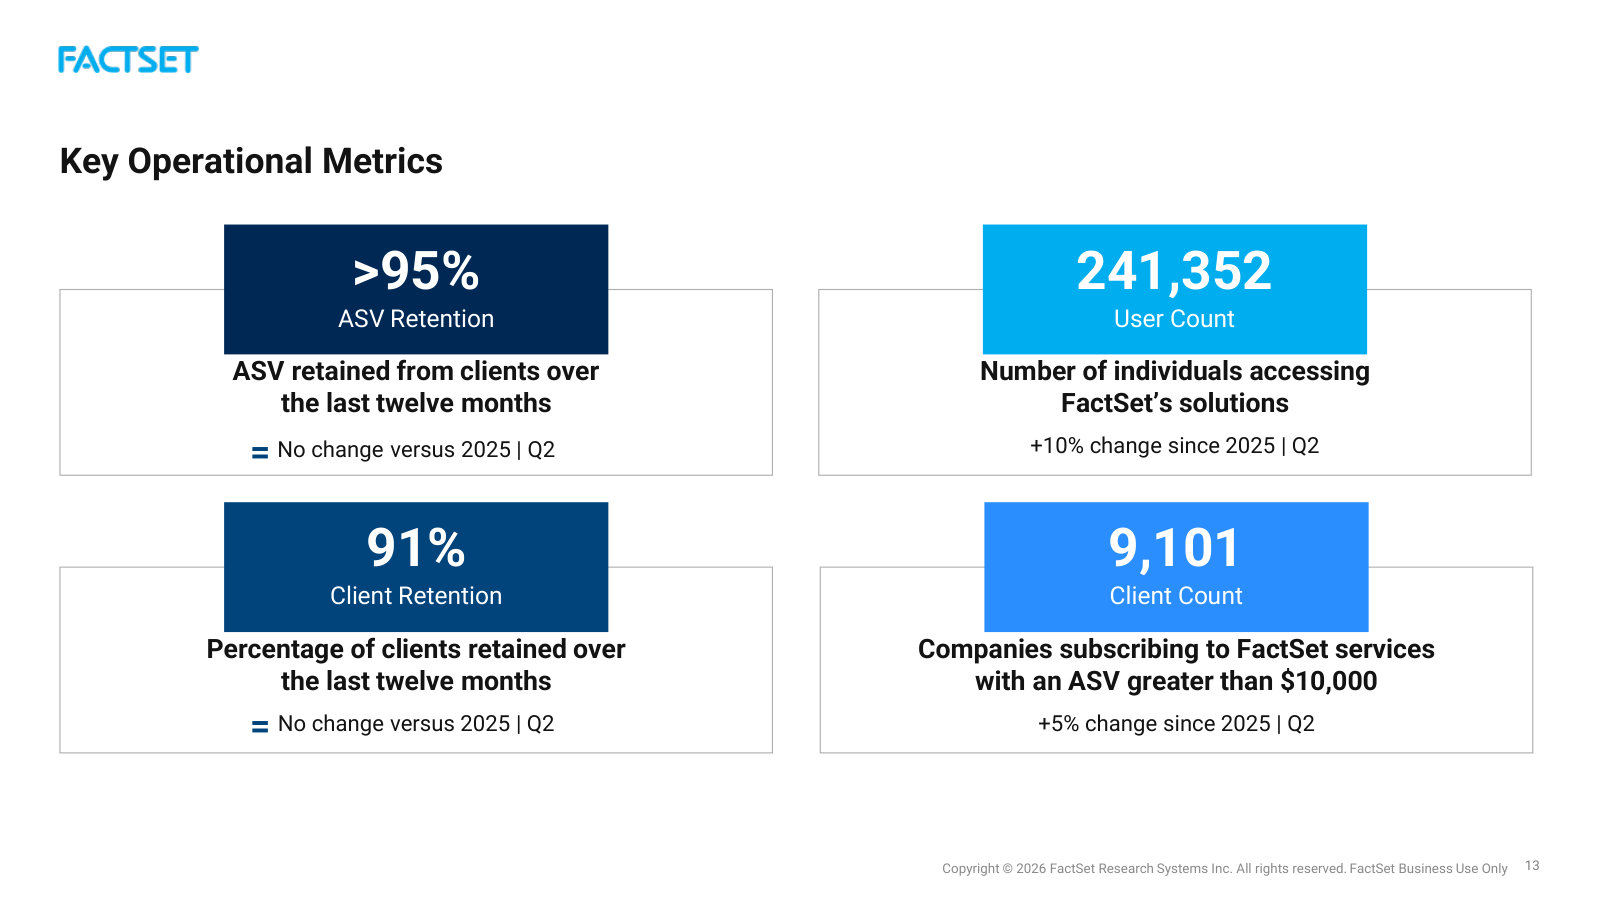
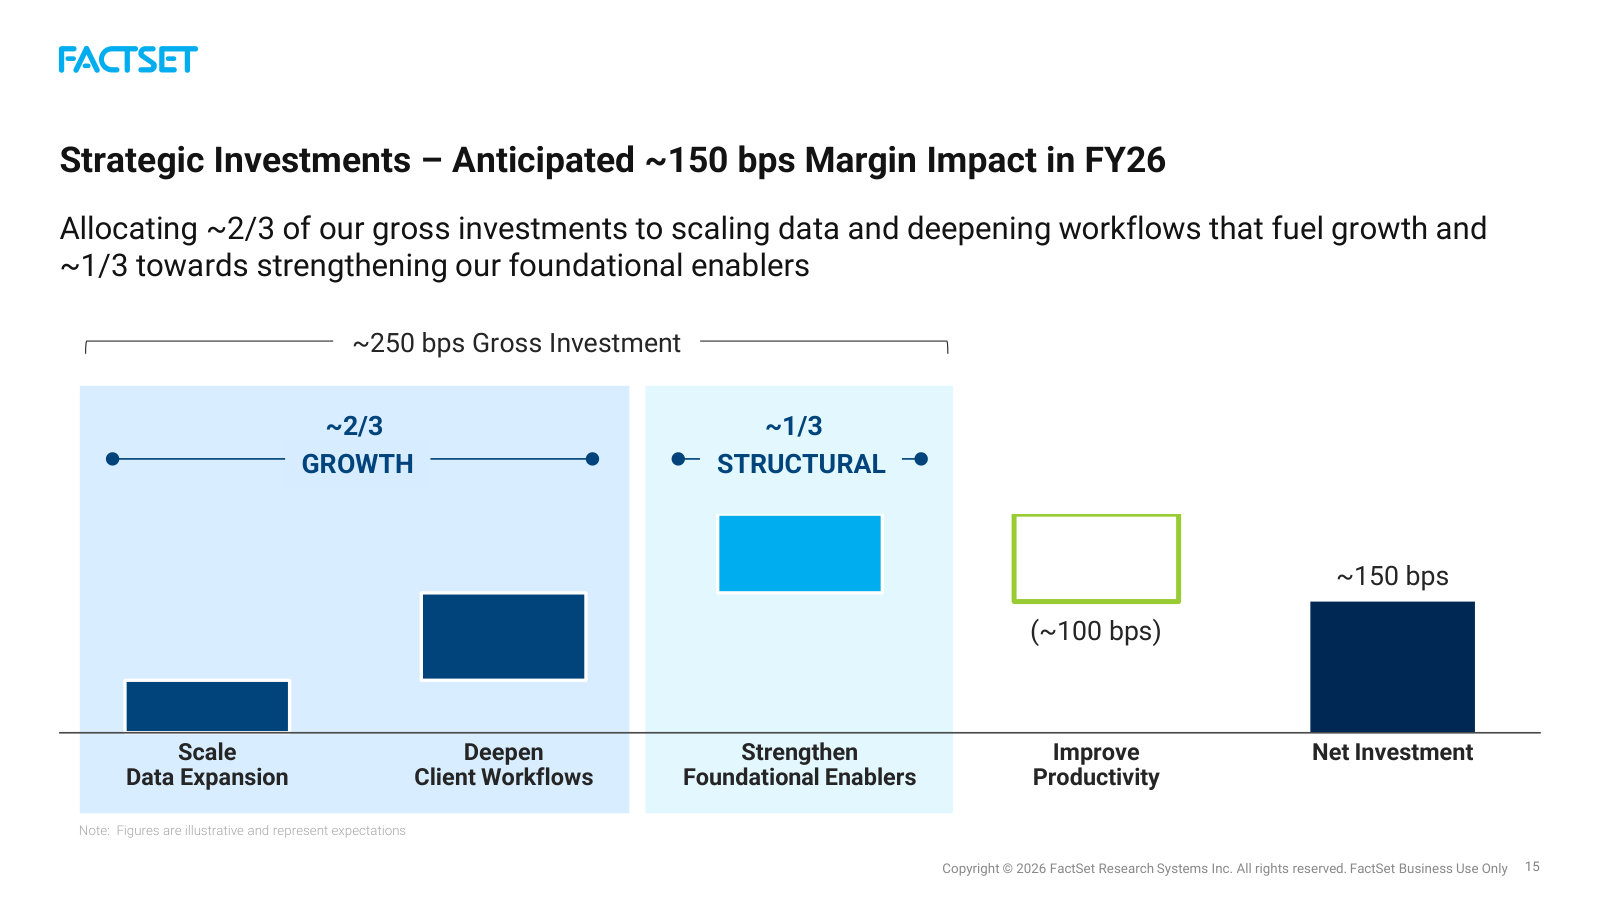
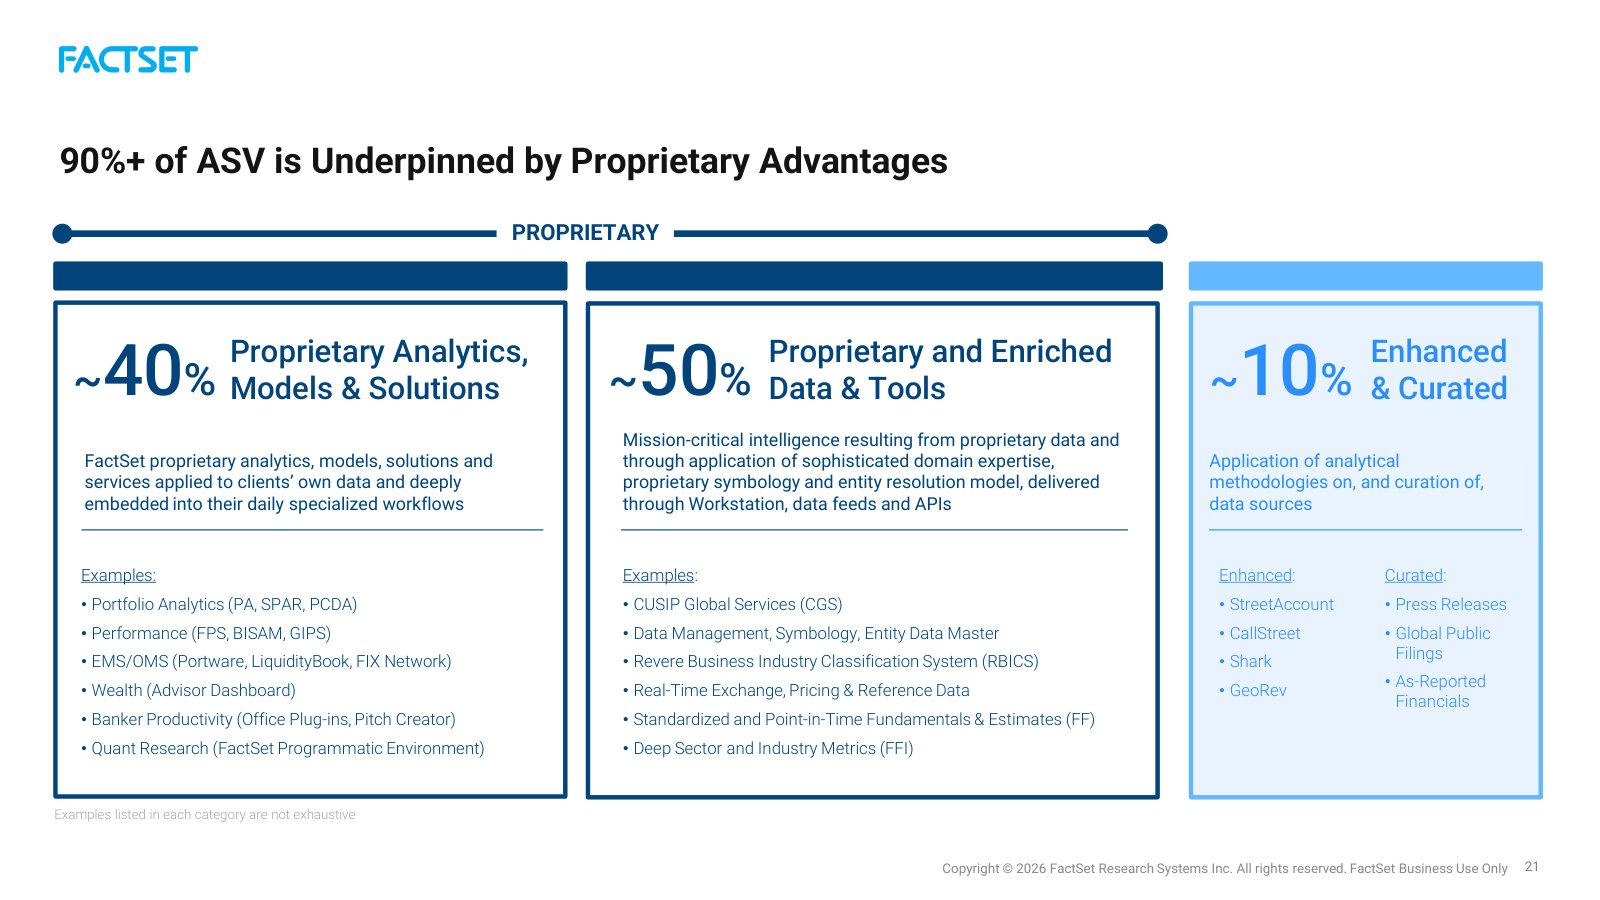
p. 8 — Why clients can't easily switch — five data properties (depth, cohesiveness, comparability, traceability, quality) that make it integral. · Open the full presentation →p. 9 — What FactSet sells beyond raw data: the data-to-risk pipeline behind one multi-asset VaR figure — 250+ fields, 1,000+ factors, Monte Carlo. · Open the full presentation →p. 13 — The subscription engine in numbers — 95%+ ASV and 91% client retention, ~241K users and ~9,100 clients, each metric defined. · Open the full presentation →p. 15 — Why FY26 margins pause: ~250 bps of gross investment (two-thirds into growth, one-third structural) netting to a ~150 bps drag. · Open the full presentation →p. 21 — How the ASV base splits by what underpins it — ~40% proprietary analytics/models, ~50% proprietary data, ~10% curated — products named. · Open the full presentation →
Q1 FY2026 Earnings Presentation — Q1 FY2026 · 25 pages · The first deck of the FY26 strategy reset; introduces the same foundational-strengths and investment framework at the year's start. · Open →
Q4 & Full-Year FY2025 Earnings Presentation — Q4 / FY2025 · 23 pages · Full-year FY2025 results, the multi-decade track record, and the FY2026 outlook that later quarters are measured against. · Open →